










Investment Review & Outlook - October 2026

Resilience at a Crossroads: AI, Earnings, and Higher Yields
Key Takeaways
- Economic growth remains resilient, supported by a solid consumer, stable employment, and massive AI investment. This resilience has helped offset higher energy prices, rising interest rates, and ongoing geopolitical risks.
- AI investment has become an important driver of strong corporate earnings and equity market performance. Rising financing needs, increasingly met through debt issuance, have raised concerns. Growing scrutiny of AI safety and its environmental impact presents increasing risks, particularly as these public policy issues gain greater attention ahead of the midterm elections.
- Higher bond yields reflect more than Federal Reserve (Fed) policy. A significant increase in AI-related spending funded through debt issuance, combined with historic fiscal deficits, is contributing to upward pressure on interest rates.
| Q3 Return | YTD Return | Value/Yield | |
|---|---|---|---|
| Dow Jones Industrial Average | -2.3% | 7.2% | 50,906.1 |
| S&P 500 | 2.3% | 12.8% | 7,651.5 |
| S&P 500 Equal Weighted | -1.9% | 10.0% | 8,429.4 |
| Nasdaq 100 | 0.4% | 20.4% | 30,408.5 |
| Bloomberg US 2000 | -7.8% | 13.4% | 1,908.4 |
| MSCI EAFE | 0.8% | 10.3% | 3,125.7 |
| MSCI EM (Emerging Markets) | -0.4% | 23.4% | 1,704.9 |
| Bloomberg US Aggregate | -3.5% | -2.9% | 5.56% |
| Bloomberg Municipal Bond | -6.4% | -4.2% | 4.78% |
| Gold (NYM $/ozt) Continuous | 3.7% | -4.4% | 4,176.3 |
| Crude Oil WTI (NYM $/bbl) Continous | 28.1% | 57.8% | 90.4 |
The Economy
Resilience Amid Competing Narratives
The US economy has remained resilient despite growing headwinds, including higher energy prices, elevated interest rates, persistent inflation, geopolitical tensions and rising concerns about the pace and safety of artificial intelligence development. Second-quarter real GDP grew at an annualized rate of 2.2%, following 2.5% growth in the first quarter. Consumer spending remains the primary driver of US economic growth, rising 2.5% over last year and up sharply from the first quarter. However, massive investment in AI infrastructure and related capital expenditures also contributed meaningfully to growth, adding approximately 1.3 percentage points.
Third-quarter real GDP growth is expected to approach 3.5%, again supported by consumer spending and the AI buildout. Together, these forces have helped offset weakness in more interest rate-sensitive areas of the economy, particularly housing. Absent a major shock, there is enough strength, particularly in AI, for the economy to continue to maintain positive GDP growth in 2027 as well.
The Consumer is Still Spending, but the Cushion is Thinner
Consumer spending accelerated this past quarter, despite weak consumer sentiment surveys. Stable employment provides support, with the labor market operating near full employment. The unemployment rate remains low at 4.2%, and layoffs remain near historic lows, though payroll growth has slowed. This slowdown is partly due to aging demographics and evolving immigration policies, meaning fewer new jobs are required to keep unemployment stable. A rise in gig work may also be supporting the labor market, particularly lower-income consumers who are more strained by higher costs.
Consumer spending, a key driver of economic growth, increasingly depends on the wealth effects of elevated asset prices. Higher-income households account for nearly 50% of total consumer spending, with a larger share of their wealth tied to equity market gains and elevated home values.
In contrast, years of inflation are straining many American consumers’ finances, and household savings are near historic lows. Higher energy prices, elevated food costs, and rising borrowing rates weigh most heavily on low- and middle-income families, which typically spend a larger share of their income on necessities and have fewer financial cushions. In addition, earlier tax and tariff-related relief is unlikely to provide the same tailwind in the second half of the year.
While overall debt levels remain manageable, delinquencies on credit cards and auto loans have increased modestly, while borrowing costs have risen. Mortgage rates recently surpassed 7% for the first time in more than three years, further weighing on housing activity. Today, approximately 20% of outstanding mortgages carry interest rates below 3%, while roughly 80% have rates below 7%, creating a meaningful “lock-in” effect that constrains housing supply.
Energy and Inflation Keep the Fed’s Task Complicated
Elevated oil prices remain an important counterweight to an otherwise resilient economic backdrop. The effects are most visible in diesel and transportation costs, but higher energy prices are increasingly filtering through to a broader range of goods and services as businesses pass rising input costs on to consumers. With oil prices elevated for eight consecutive months, the inflationary impact is becoming more widespread. Food prices also remain elevated and could face additional upward pressure if the expected super El Niño, a severe weather event that occurs every few years, disrupts planting, damages harvests or strains food supply chains.
Headline inflation, which began the year at 2.4%, has risen to 3.4%, while core inflation, which excludes food and energy prices, remains stubbornly elevated at approximately 2.5%. The longer geopolitical tensions and supply disruptions persist, the greater the risk that higher energy costs become embedded across the broader economy, complicating efforts to bring inflation back to target and increasing the risk of slower growth.
Artificial Intelligence
An Investment Cycle of Unprecedented Scale
AI is no longer just a technology story. It has become a meaningful driver of economic growth, influencing corporate investment, consumer spending through wealth creation, energy infrastructure, capital markets and public policy. The AI buildout has contributed significantly to equity market returns over the past four years and, more recently, has become a growing source of corporate debt issuance as hyperscalers’ cash flows are no longer sufficient to fund AI investments. Hyperscalers, which are the large technology companies that provide cloud computing, data storage and networking services on a massive scale, have been the leaders of this AI investment cycle. Notably, this wave of investment has proven relatively insensitive to interest rates despite increasing reliance on debt financing, as companies remain focused on the long-term expected returns rather than the incremental increases in borrowing costs.
AI is also emerging as an important issue in the upcoming midterm elections as data center development, rising electricity costs, and local infrastructure needs become increasingly visible concerns for voters.
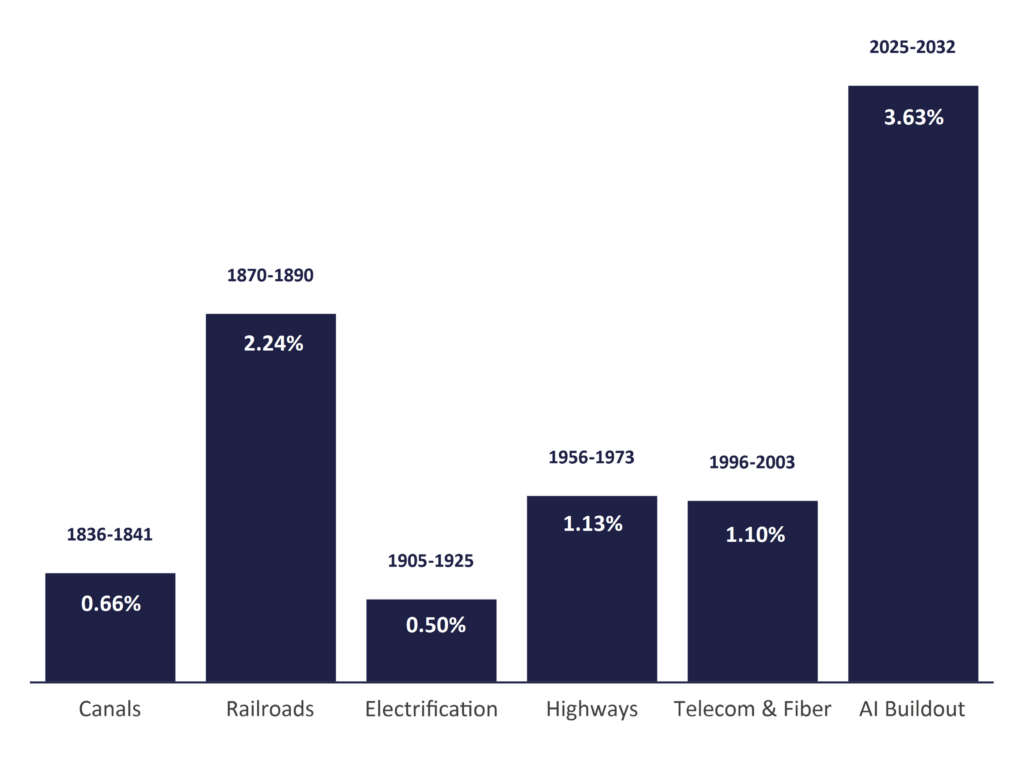
At its current scale, the AI infrastructure build-out rivals or exceeds several of the largest technology investment cycles in history, including the telecommunications boom of the late 1990s, which peaked at roughly 1.5% of GDP, and the railroad expansion of the late nineteenth century, which reached just over 2% of GDP. The scale of this build-out underscores both the magnitude of the current AI cycle and its growing influence on the broader economy.
Percent of GDP from Historical Infrastructure Build-Outs
AI Delivers the Largest Capex-Driven Boost to GDP in History
Source: Bloomberg Opinion (Stijn Van Nieuwerburgh, Columbia Business School)
While the current growth trajectory is unlikely to last indefinitely, spending should remain elevated. Estimates suggest hyperscaler capital spending could reach approximately $800 billion by year end, 45% higher than January estimates, increasing to $1 trillion in 2027 and a cumulative $5.5 trillion by 2030, of which approximately $4.1 trillion is expected to be debt-financed through both the public and private markets.
With two major AI companies expected to go public in the coming months (Anthropic and OpenAI), scrutiny is likely to increase due to recent hacking incidents involving advanced AI systems, the risks of increasingly capable models, and the speed at which they are being deployed. As a result, these companies are seeking liability protection from policymakers.
So far, investors have not seemed particularly concerned about the AI ecosystem’s financial structure, with its circular flow of capital among many of its largest participants. Several companies simultaneously serve as customers, suppliers, investors, and financing partners, creating a highly interconnected network of relationships. For example, Nvidia’s customer concentration has increased significantly: two customers account for nearly 40% of its second-quarter revenue, and large hyperscalers, such as Microsoft and Alphabet, account for nearly half of its data center revenue. As a result, changes in capital spending plans, financing conditions, or adoption expectations among a relatively small number of firms could have large ripple effects throughout the markets and the economy.
Even four years into the investment cycle, we are likely still in the early stages of AI adoption, and history suggests that not every participant will emerge as a winner. The internet revolution, which ultimately transformed the global economy, saw many early leaders fail to maintain their advantage despite benefiting from the initial wave of investment. To date, hyperscalers, semiconductor companies, and hardware providers, the “picks and shovels” of AI, have been the primary beneficiaries. The next phase of value creation may increasingly favor companies that successfully demonstrate how AI is actually improving productivity, lowering costs, enhancing customer experiences, and strengthening competitive positioning.
The Equity Market
Equity Markets’ Narrow Leadership
A relatively small group of large-cap technology and artificial intelligence beneficiaries once again drove index returns this quarter, reversing some of the market broadening seen in the first half of the year. While major indices remain near record highs, the average S&P 500 stock remains well below its 52-week high. The S&P 500 Equal Weight Index, a useful barometer of the average stock because each company carries the same weight, fell nearly 1.9% during the quarter and is now up 10.0% year-to-date. In contrast, the cap-weighted S&P 500 gained 2.3% during the quarter and is now up 12.8% year-to-date.
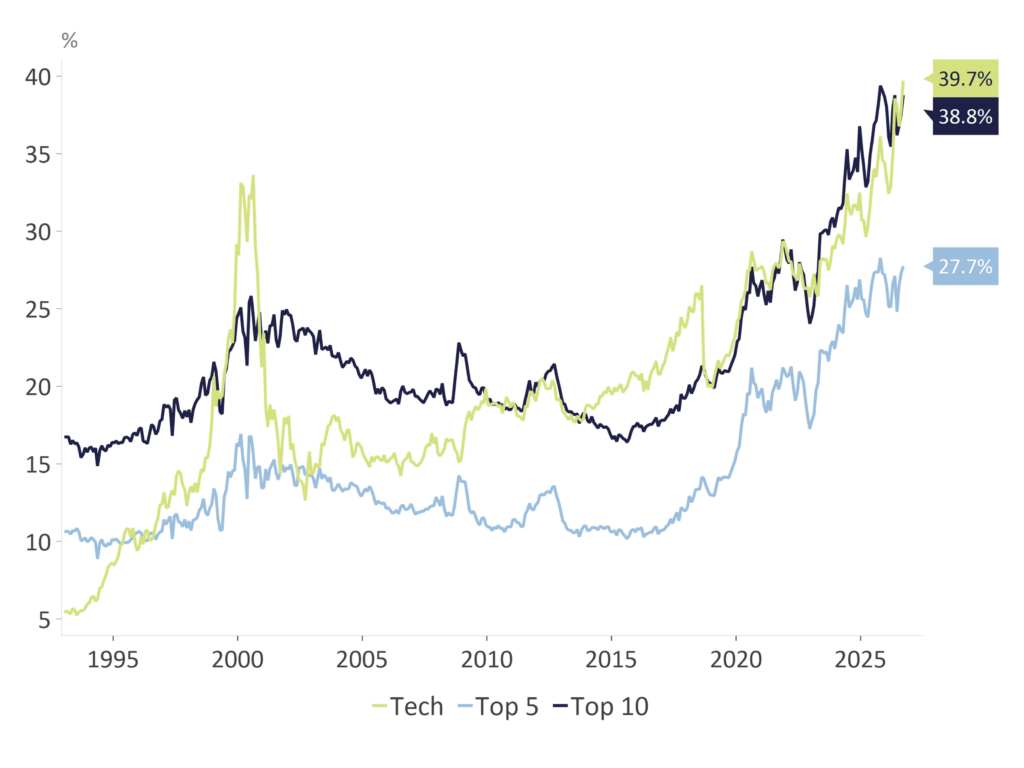
This divergence reflects the continued outperformance of a relatively small number of large-cap technology and AI-related companies, whose growing market capitalizations have increased their impact on index returns as the index becomes more concentrated. As seen in the chart below, the ten largest companies now account for nearly 40% of the S&P 500’s market capitalization, the highest level in recent history, with technology companies representing most of that concentration. While this leadership has supported overall market performance, it leaves the broader market vulnerable should momentum in these companies begin to fade.
S&P 500 Exposure
Index Weight of the Technology Sector and the Top 5 & 10 Companies over Time
Source: Bloomberg
Top 5 & 10 lines use the B500 Index as a proxy for the S&P 500
Data: Monthly from 1/30/1993 – 9/30/2026
Earnings Provide Support Amid Competing Narratives
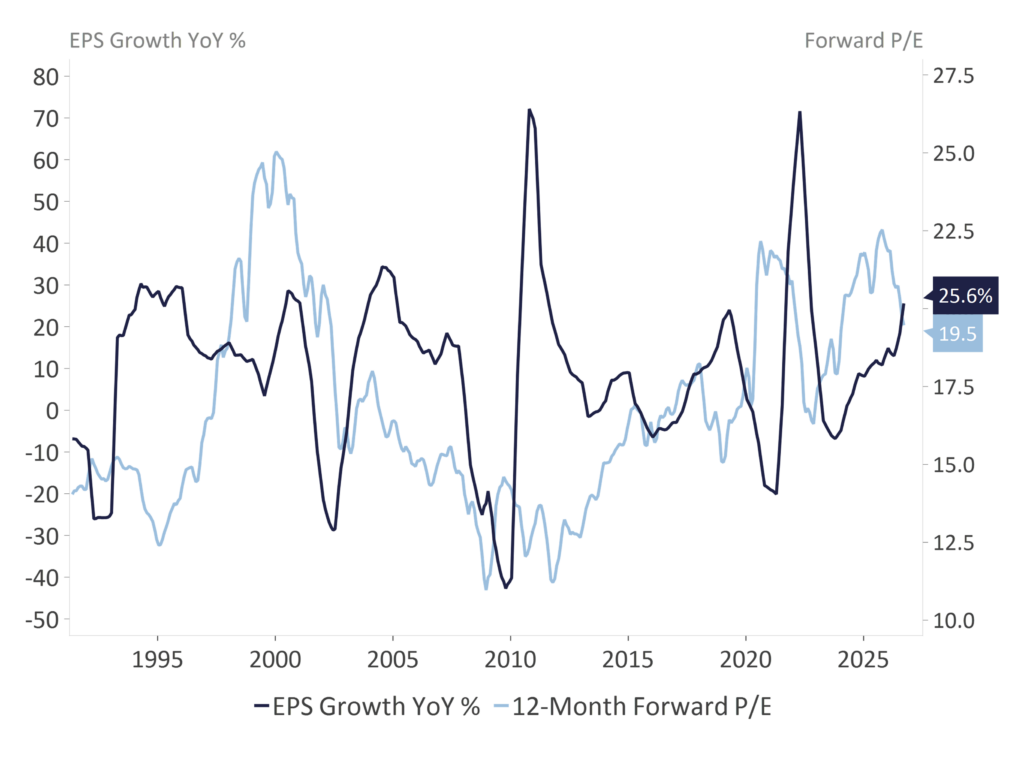
Earnings growth remains the market’s most important fundamental support. Second-quarter earnings rose about 51%, although the headline figure was boosted by sizable, unrealized gains in private AI investments, including Anthropic and OpenAI. Excluding these gains, earnings growth was closer to 29%, still well above the roughly 24% consensus expectation and impressive by historical standards, nonetheless.
Expectations continue to be revised higher. Consensus estimates call for 27% earnings growth in the third quarter, with full-year 2026 earnings expected to rise 33% and 15% in 2027. The equal-weighted index earnings growth, while lower, remains strong at 20% and 10%, respectively. Importantly, despite the current market concentration, earnings growth is becoming increasingly broad-based, with most sectors expected to deliver double-digit growth. Faster earnings growth has reduced the S&P 500 forward price-to-earnings ratio closer to 19x, near its lowest level of the year.
Earnings Growth & Valuation
S&P 500 EPS Growth and Forward P/E
Source: Macrobond, FactSet
Data: Monthly from 1/1990 – 9/2026
Rising interest rates pose a growing risk for equity valuations. With the 10-year Treasury yield now above 5%, bonds offer meaningful competition for investor capital. At the same time, higher yields reduce the value of future earnings, which get discounted using today’s higher rates. Historically, equities come under pressure when interest rates rise quickly, in a disorderly manner, or after several Fed rate hikes. In 1987, the Fed hiked rates three times and long-term yields jumped three percentage points before the market declined, while in 2000, the Fed hiked rates five times before the tech bubble burst.
Demand for Technology Stocks Insatiable, while Increase in Leverage May Increase Volatility
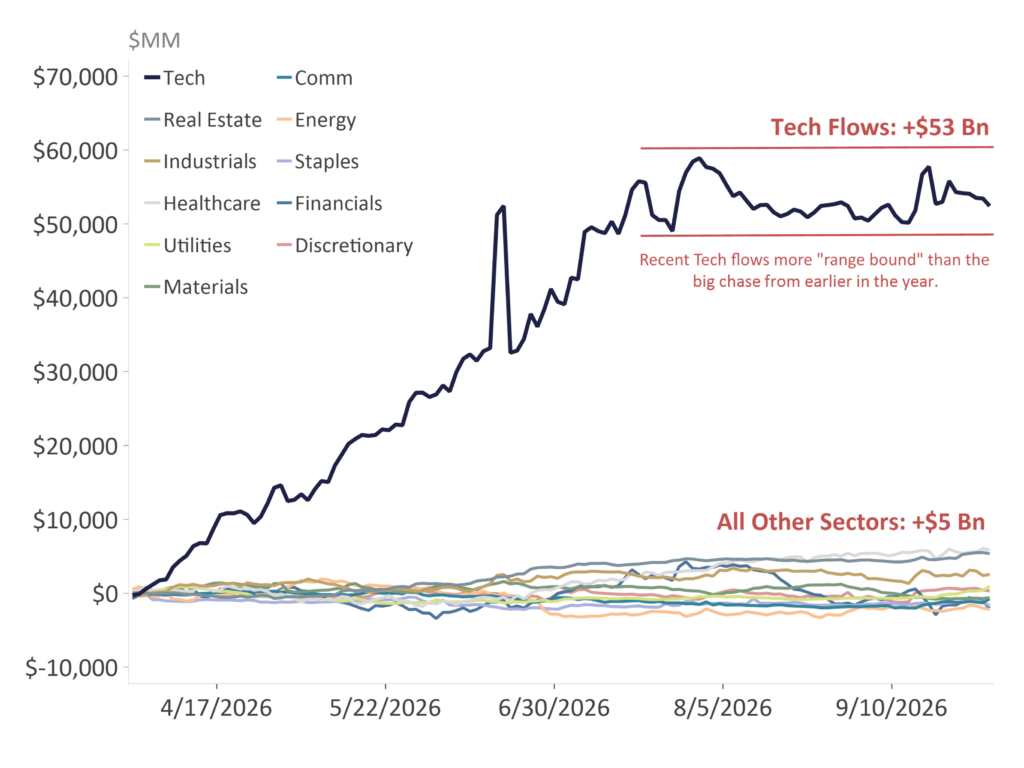
Flows into exchange-traded funds (ETFs) are often viewed as a proxy for investor sentiment and positioning. Notably, technology-focused ETFs are still attracting substantial inflows. Although flows have moderated somewhat from their second-quarter peak, they remain quite elevated.
Cumulative Sector ETF Flows
Since March 30th, S&P 500 Low
Source: Macrobond, Strategas
Data: Available daily from 3/30/2026 to 9/30/2026
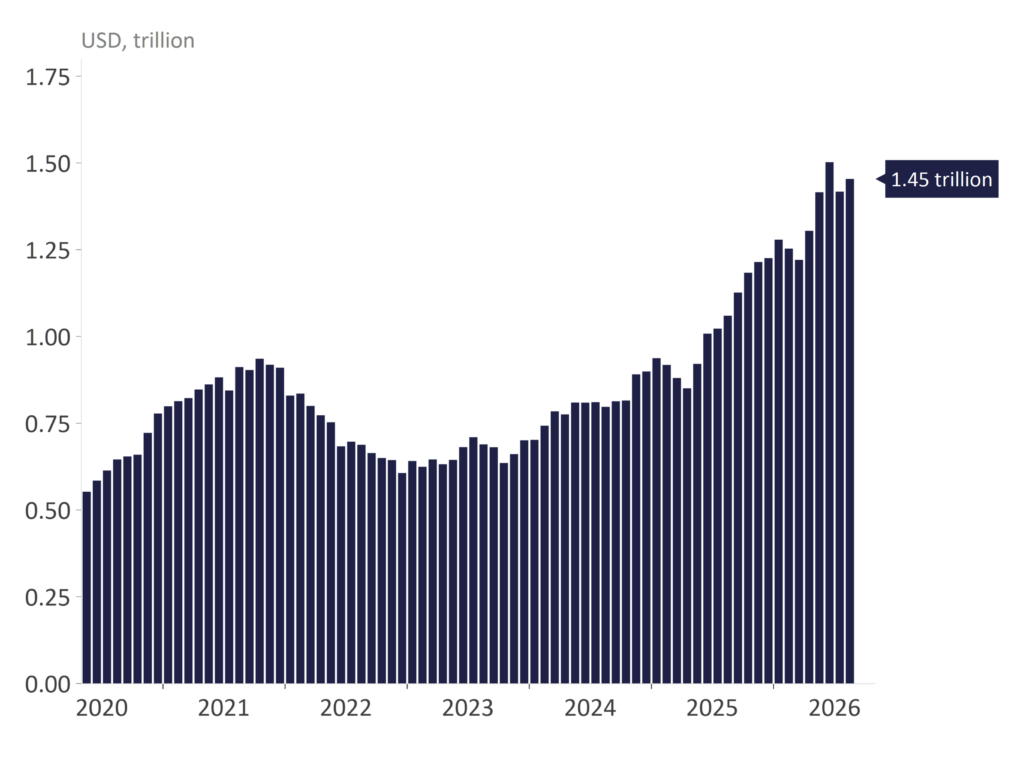
At the same time, demand for leveraged ETFs, which use derivatives and borrowing to amplify the daily returns of an underlying index, theme or even a single stock, has surged among retail investors, particularly in funds tied to technology and AI-related themes. Margin debt has also increased sharply, reaching a record approximately $1.45 trillion, nearly 40% higher than a year ago.
This suggests investor positioning has become increasingly aggressive. While leverage can amplify returns during rising markets, it can exacerbate volatility and accelerate selling pressure if sentiment shifts or the market corrects.
Margin Debt Outstanding
Source: Macrobond, FINRA
Data: Monthly from 5/2020 – 8/2026
Midterm Election Year Volatility
The midterm elections will take greater focus in the coming weeks. With the equity market currently pricing in a Democratic sweep, Republican lawmakers are considering raising the US debt limit before the elections to avoid a standoff between President Trump and a Democratic Congress, as the federal borrowing authority is on track to run out in the second half of 2027.
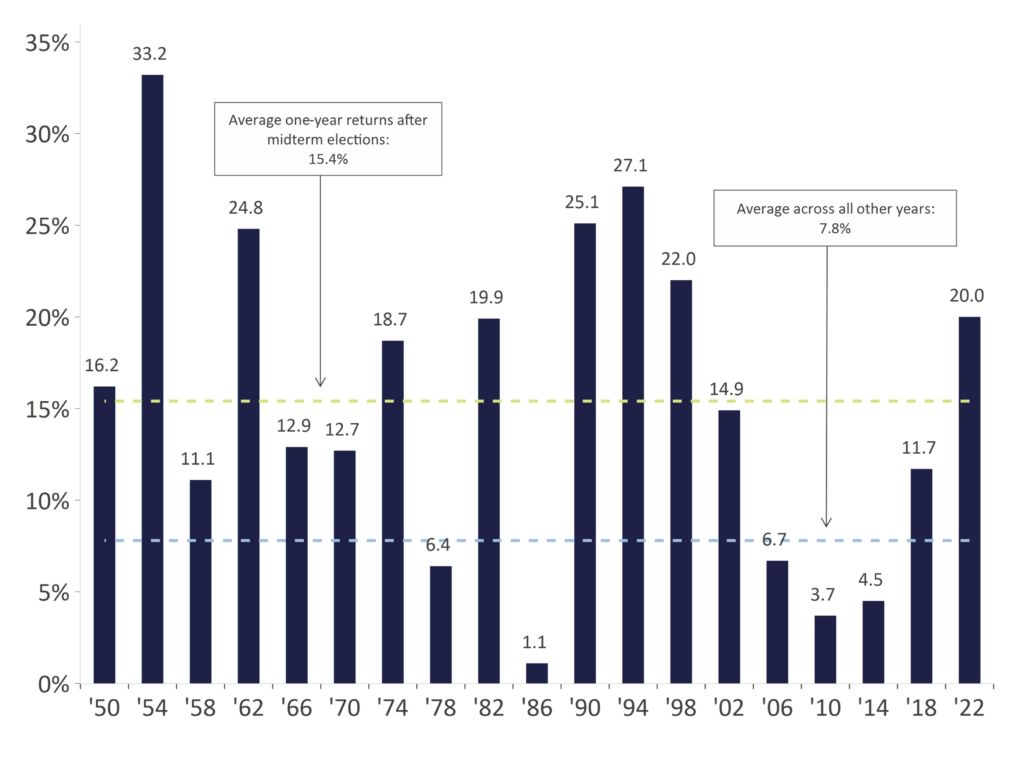
Volatility may increase leading up to the elections, as investors generally dislike uncertainty. History cautions against assigning too much long-term investment significance to a single election outcome though, as durable economic trends, corporate fundamentals, valuations, and interest rates have a bigger impact on market returns over a full market cycle.
Post-Election Rebounds Have Been Strong
S&P 500 index price return one year after midterm election
Source: Bloomberg
Data: Available annually from 1950 to 2025
Fixed Income
Higher Yields Reflect More Than Fed Policy
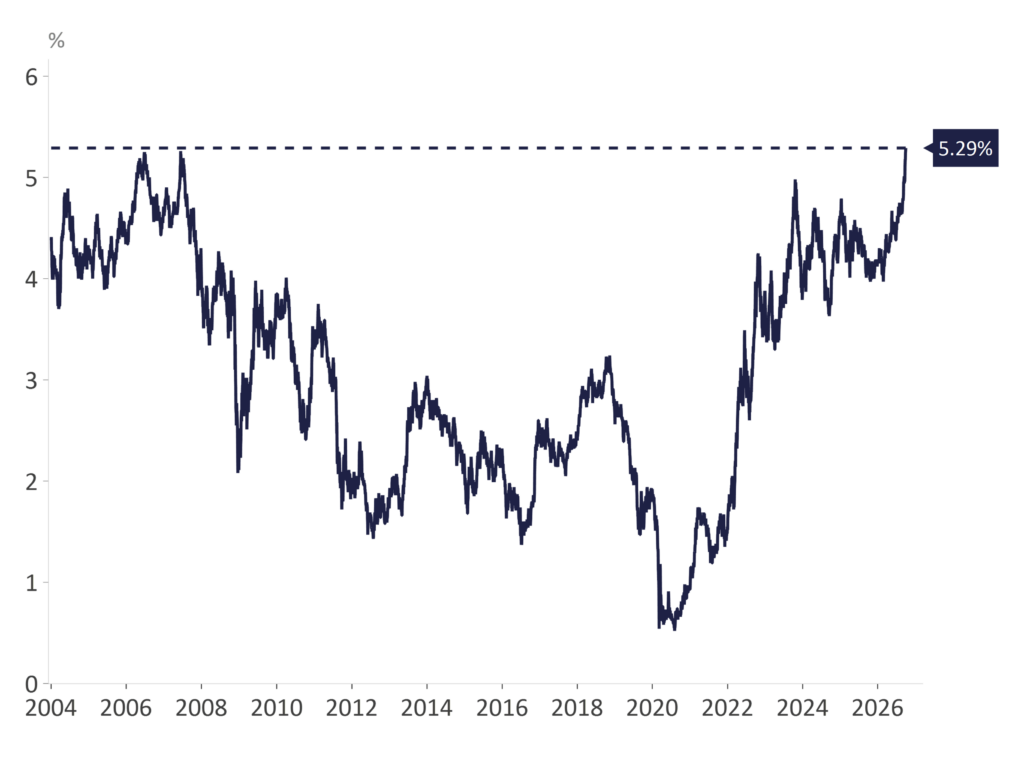
Yields have risen sharply around the world and are now near multi-decade highs as concerns about government finances continue to grow. The 10-year Treasury yield is approaching 5.3%, its highest level since before the Global Financial Crisis, as investors demand greater compensation to hold Treasuries due to the massive federal debt levels, as well as the growth in debt issuance by both the Treasury and technology companies, alike.
Higher yields raise the cost of servicing the ballooning federal deficit. Today, net interest payments on the US debt total approximately $1 trillion annually, making them the federal government’s second-largest spending category, surpassing both national defense and Medicare, and accounting for more than 14% of federal outlays. The Congressional Budget Office’s latest projections show net public debt rising from 123% of GDP this year to more than 175% by 2056. Rising debt levels and interest costs place additional upward pressure on yields, creating a potentially self-reinforcing cycle of higher debt, higher interest costs, and larger deficits.
10-Year US Treasury Yield
Source: Macrobond
Data: Available daily from 1/2/1962 – 9/30/2026
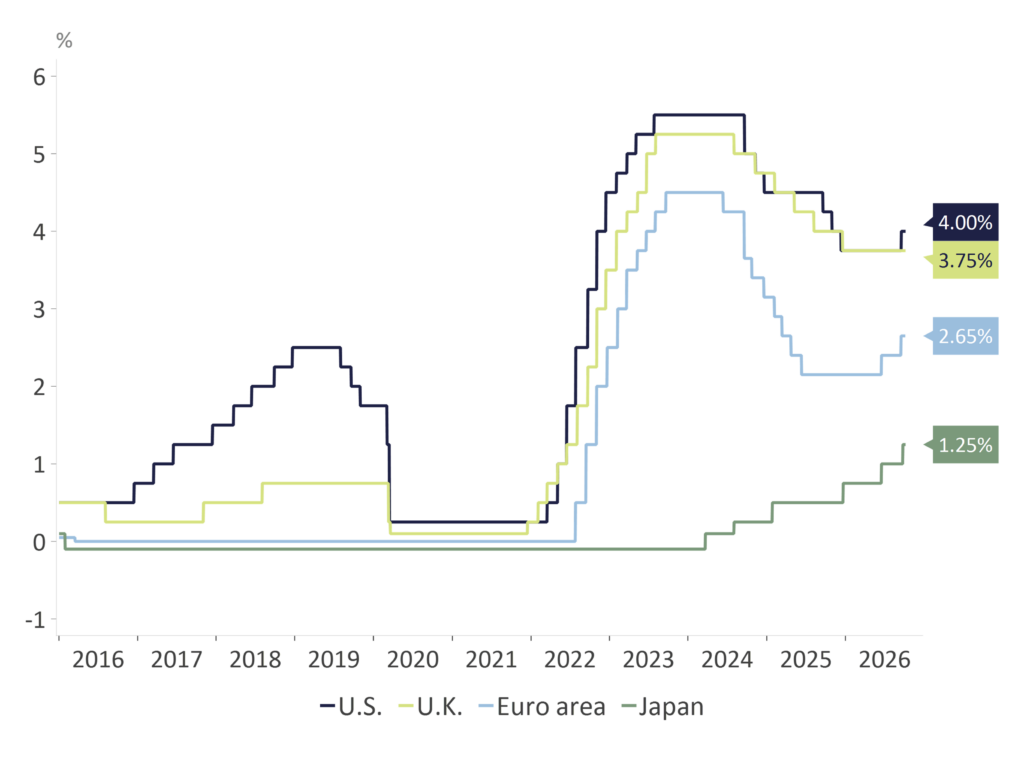
Global Central Bank Policy Rates
Many Advanced Economies’ Central Banks Hiking Rates
Sources: Federal Reserve, Bank of England, European Central Bank, Bank of Japan
Data: Available daily from 1/1/1999 – 9/30/2026
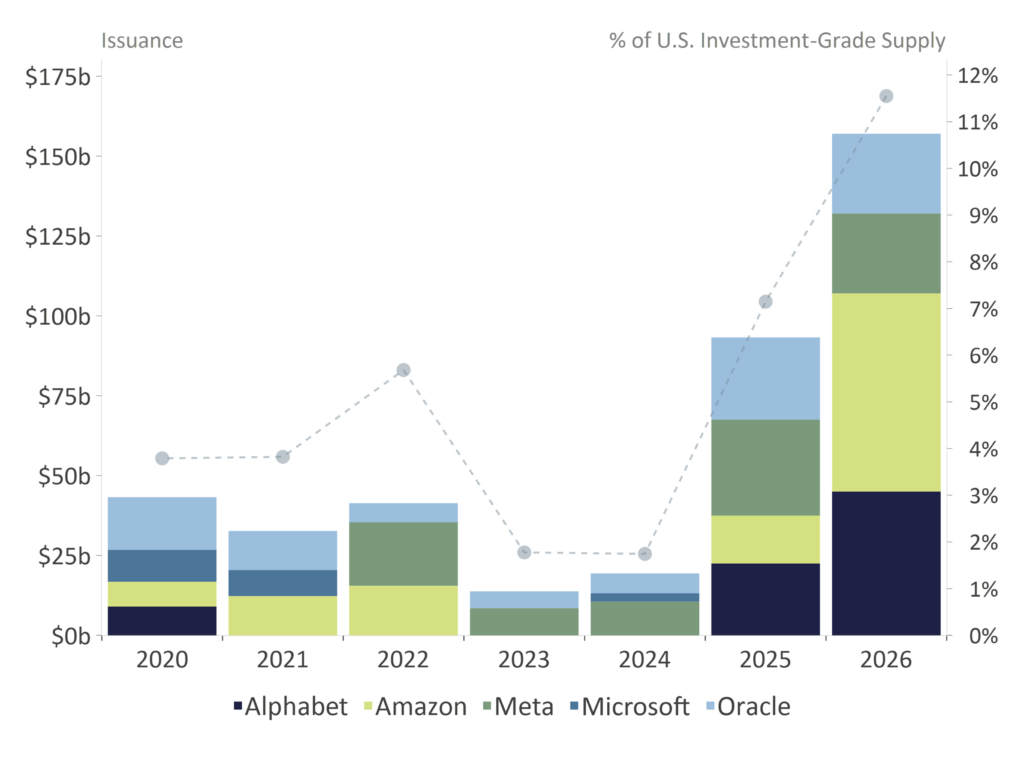
At the same time, a surge in borrowing by mega-cap technology companies is creating competition for capital across debt markets. For the past several years, hyperscalers largely funded their AI investments through operating cash flow. As capital spending requirements have accelerated and cash flow has become increasingly constrained, many companies are now turning to the bond market to finance a portion of their investment needs. Today, these companies account for nearly 12% of investment-grade bond issuance, creating a level of issuer concentration that has been uncommon in the corporate bond market. Given the substantial capital expenditure tied to AI infrastructure expected over the next several years, issuance is likely to remain elevated, adding additional upward pressure on yields.
Hyperscaler Borrowing
Total issuance from hyperscalers has become a market driver
Source: Bloomberg
Data: Available annually from 2020-2026
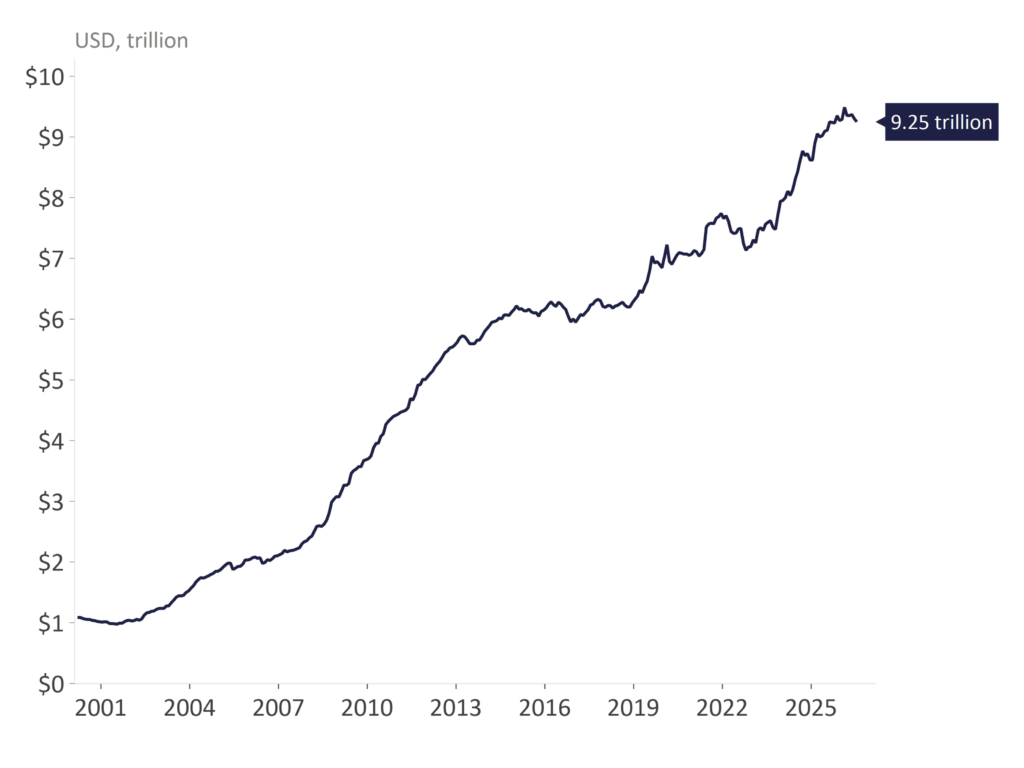
At the same time, foreign demand for US Treasuries has declined over the past two decades. Foreign investors now hold approximately 40% of outstanding Treasury securities, below peak levels of 45% in 2008. As foreign demand has declined, a larger share of Treasury issuance must be absorbed by domestic investors, or there is the risk of higher yields as a result.
Foreign Holders of UST
Source: Macrobond, Foreign Holders of UST Securities
Data: Available monthly from 3/2000 – 7/2026
Top 3 Foreign Holders of US Treasuries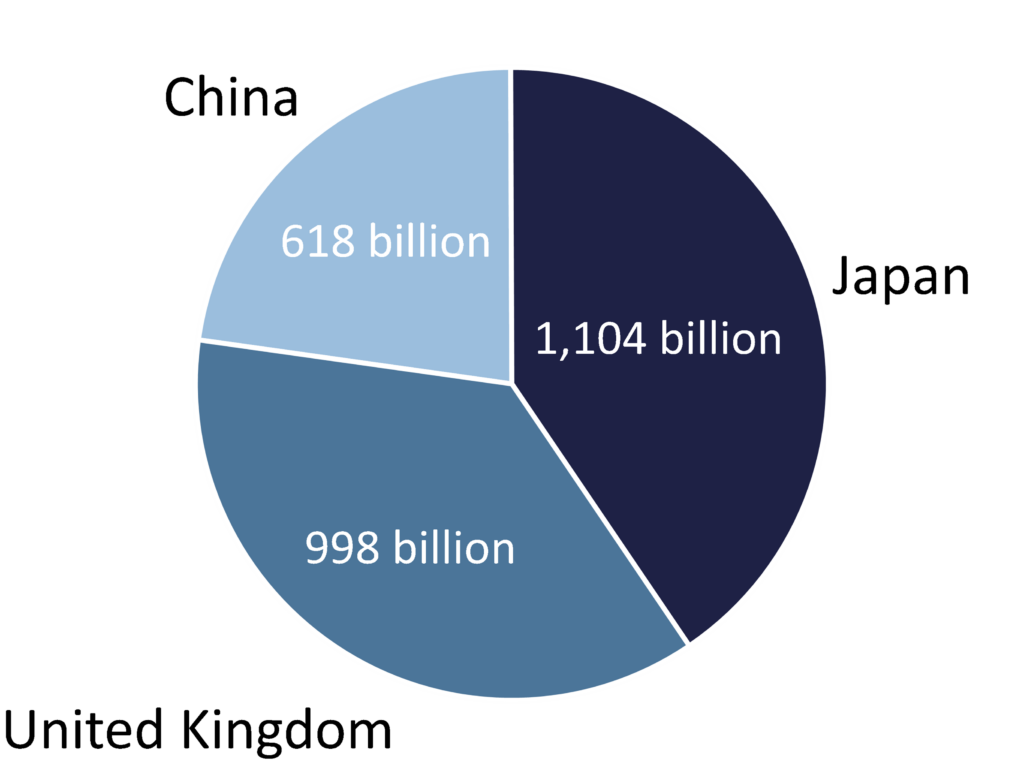
Source: Macrobond, Foreign Holders of UST Securities
Data: As of 2026 Q3
Japan, the largest international holder of US debt, has public debt exceeding 240% of GDP. After about a decade of yield curve control, Japanese interest rates have moved markedly higher, and the Bank of Japan is tightening monetary policy, increasing the relative attractiveness of Japanese government bonds versus US Treasuries, potentially diminishing another source of US Treasury demand.
Against this backdrop, US Treasury Secretary Scott Bessent intervened in the currency markets in August to help stabilize a very weak Japanese yen and reduce the risk of Japan selling its US Treasury holdings to support its own currency. Any meaningful reduction in Japanese demand for Treasuries has the potential to put upward pressure on US yields.
While the White House and the Treasury have sought to limit upward pressure on long-term rates, the Fed is moving in the opposite direction by tightening monetary policy to combat rising inflation. At first glance, it may seem that the two are at odds. However, the Fed’s actions primarily affect the short-end and have less influence on the long-end, which is more market-driven. In September, the Fed unanimously raised its policy rate by 25 basis points to a range of 3.75% to 4.00%, its first increase in three years. The Fed’s latest projections imply one additional rate hike by year-end and no further increases in 2027, although financial markets are currently pricing in three to four additional rate hikes by mid-2027.
Since becoming Fed Chair in May, Kevin Warsh has reduced the amount of forward guidance provided by the Fed, marking a departure from the highly transparent approach that followed the Global Financial Crisis. The shift reflects a return to a more traditional framework in which policymakers provide less explicit guidance on the future path of interest rates. While this may offer the Fed greater flexibility, it could also increase market volatility as investors rely less on Fed projections and more on incoming economic data.
Conclusion
Resilience, Crosscurrents, and the Importance of Perspective
Markets are navigating various crosscurrents, including higher energy prices, ongoing geopolitical tensions, elevated rates, and AI-safety concerns. AI capital expenditures continue at a remarkable pace, and consumer spending remains solid, bolstering economic growth. Additionally, strong earnings have kept equities near record highs, with double-digit growth expected throughout the rest of the year and into 2027.
While we expect the economy and earnings to grow, the pace may moderate from the exceptionally strong second-quarter pace, and volatility may increase as we approach the midterm elections in November. A slowdown would not imply recession though, as stable employment, improving industrial activity, strong profits, and higher bond income remain constructive offsets.
We continue to emphasize high-quality companies, reasonable valuations, and strong balance sheets. In fixed income, higher yields create attractive income opportunities. A well-diversified portfolio aligned with long-term objectives remains the most reliable way to navigate periods of uncertainty.
The information provided here is for general informational purposes only and should not be considered an individualized recommendation or personalized investment advice. No part of this material may be reproduced in any form, or referred to in any other publication, without the express written permission of 1919 Investment Counsel, LLC (“1919”). This material contains statements of opinion and belief. Any views expressed herein are those of 1919 as of the date indicated, are based on information available to 1919 as of such date, and are subject to change, without notice, based on market and other conditions. There is no guarantee that the trends discussed herein will continue, or that forward-looking statements and forecasts will materialize. This material has not been reviewed or endorsed by regulatory agencies. Third party information contained herein has been obtained from sources believed to be reliable, but not guaranteed.
There is no guarantee that employees named herein will remain employed by 1919 for the duration of any investment advisory services agreement.
1919 Investment Counsel, LLC is a registered investment advisor with the U.S. Securities and Exchange Commission. 1919 Investment Counsel, LLC, a subsidiary of Stifel Financial Corp., is a trademark in the United States. 1919 Investment Counsel, LLC, One South Street, Suite 2500, Baltimore, MD 21202. ©2026, 1919 Investment Counsel, LLC. MM-00002726