


Investment Review & Outlook - January 2026

Balancing Resilience and Risk in a Shifting Economy
Key Takeaways
- US GDP is estimated to accelerate in 2026, propelled by fiscal stimulus in the form of consumer tax refunds and corporate tax incentives in the 2025 OBBB legislation. Consumer spending continues to support the expansion, yet it is increasingly driven by higher-income households, leaving overall growth especially sensitive to market returns and wealth effects.
- Equity market leadership is beginning to broaden beyond AI-related mega-cap stocks, a healthy development following a period of extreme concentration. Earnings growth from ongoing capital expenditures should support stock prices. However, valuations remain elevated, and concentrations still exist.
- The Federal Reserve has shifted toward a more accommodative stance as labor-market conditions have cooled, but policy uncertainty will be a focus for investors amid concerns about Fed independence and rising US debt levels.
| QTD Return | YTD Return | Price/Value | |
|---|---|---|---|
| Dow Jones Industrial Average | 4.0% | 14.9% | 48,063 |
| S&P 500 | 2.7% | 17.9% | 6,846 |
| S&P 500 Equal-Weighted | 1.4% | 11.4% | 7,764 |
| Bloomberg US 2000 | 2.4% | 11.1% | 1,698 |
| MSCI EAFE | 4.9% | 31.9% | 2,893 |
| MSCI EM (Emerging Markets) | 4.8% | 34.4% | 1,404 |
| Bloomberg US Aggregate | 1.1% | 7.3% | 94 |
| Bloomberg Municipal Bond | 1.6% | 4.2% | 102 |
| Gold (NYM $/ozt) Continuous | 12.1% | 64.4% | $4,341 |
| Crude Oil WTI (NYM $/bbl) Continous | -7.9% | -19.9% | $57 |
The Economy
We expect that US economic expansion will continue in 2026, driven by a combination of fiscal policy designed to boost the economy and a likely dovish Fed. The One Big Beautiful Bill Act (OBBB) was designed to deliver fiscal stimulus heading into a midterm-election year by expanding tax deductions, credits, and refunds in the range of $150 billion. Some of the changes took effect in July when the bill was passed and should result in tax refunds as early as this spring. Others will take place throughout 2026 as paycheck withholding tables adjust and take-home pay for many workers may increase.
Corporate tax incentives, which were retroactive to January 2025, include 100% expensing of capital equipment purchases and domestic research and development costs, higher interest deductions, and immediate expensing of the cost of building production and manufacturing facilities. The corporate incentives in the bill are estimated to have provided more than $100 billion of stimulus in 2025 with another $135 billion expected for 2026.
At the same time, enacting the tax bill was a clear indication that any focus on deficit reduction is off the table for now. In fact, the OBBB is expected to increase the deficit by more than $3 trillion over the next 7 years, plus an additional $441 billion in interest costs.
Consumer Health and Sentiment: The K-Shaped Reality Deepens
There remains an increasingly uneven profile of US economic growth, characterized by a K-shaped structure, a trend that will be further skewed by many of the tax benefits in the OBBB. Higher-income households, supported by equity market gains and accumulated wealth, continue to account for a disproportionate share of overall spending, which is the biggest driver of US economic growth. At this stage of the cycle, equity markets are increasingly becoming a significant driver of consumer behavior, rather than merely a reflection of economic conditions. As a result, market performance has a more direct influence on confidence and discretionary spending, than in prior cycles. As of fiscal year 2024, roughly 50% of government revenue came from individual income taxes. It is easy to see how a significant market decline would not only affect economic growth but also put pressure on tax receipts needed to fund government spending without relying on further debt issuance.
Lower-income households face a very different reality. Rising debt balances, higher delinquency rates, and declining real wages continue to pressure budgets for a group that often lives paycheck to paycheck, leaving little margin for error should labor market conditions weaken further. Taken together, these dynamics suggest a consumer environment that remains supportive of growth but is more fragile and sensitive to market and policy shocks.
Stock Market Ownership
Proportion of Household Assets Invested in Equities
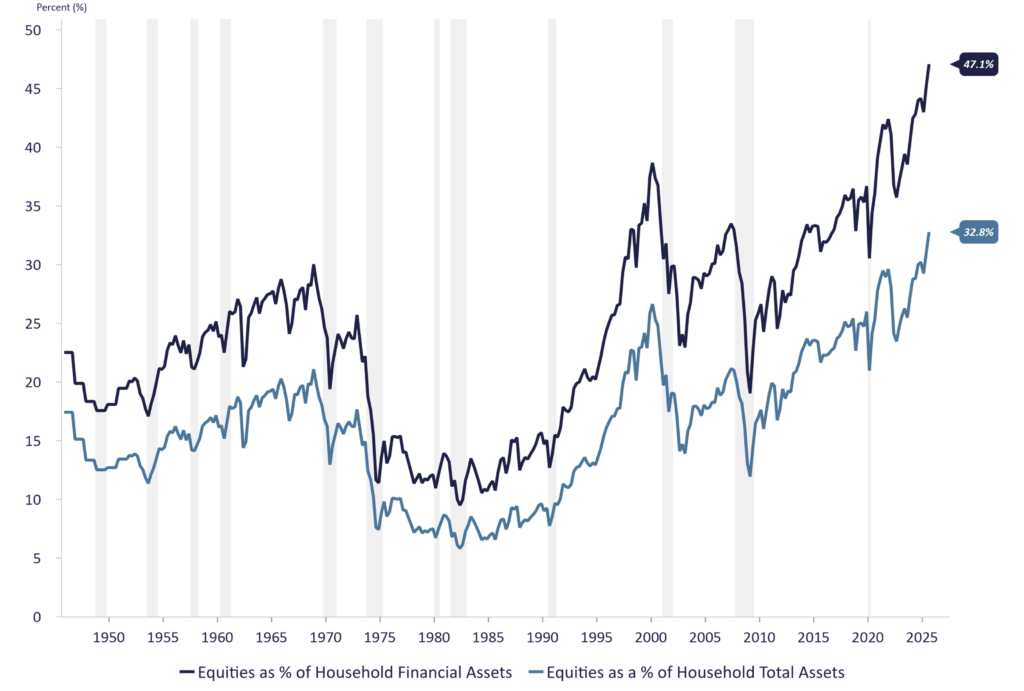
Recessions are indicated by the shaded area.
Federal Reserve, Financial Accounts (Flow of Funds) – Z.1
Households & Nonprofit Organizations, Directly & Indirectly Held Corporate Equities
Quarterly data available from 1945 Q4 to 2025 Q2, last released on Thursday, September 11, 2025
Share of Spending by Consumers in Top 10% of Income Distribution
High-income Americans are behind roughly half of all US consumer spending, up from about a third in the early 1990s
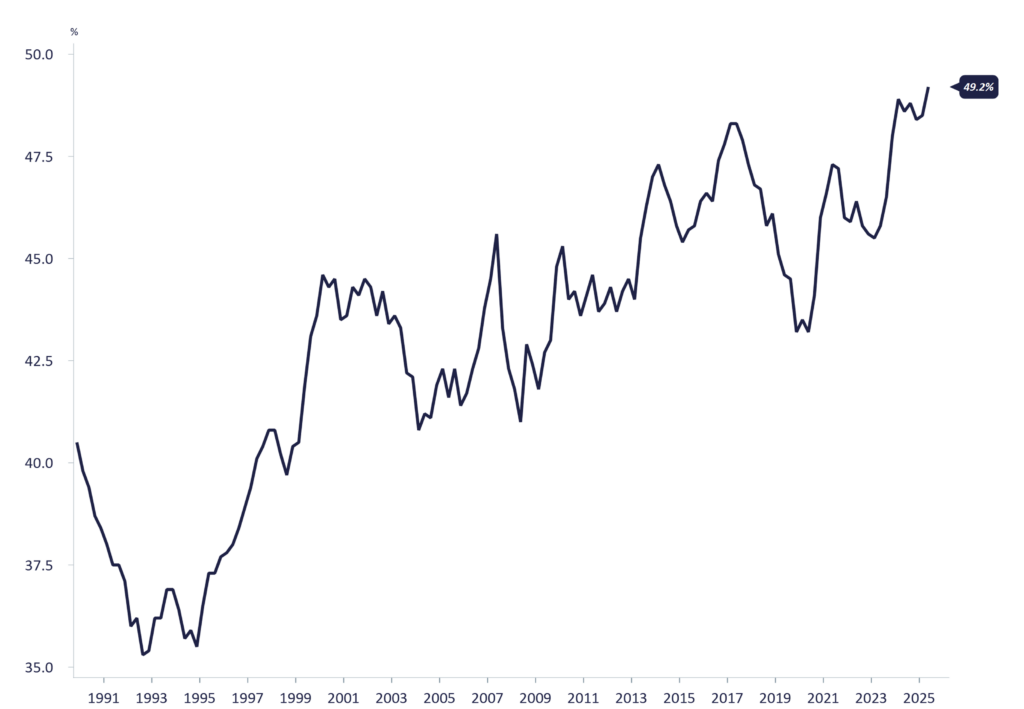
Source Bloomberg News Release (Moody’s Analytics review of Federal Reserve Data)
Data: Quarterly from 1989 Q4 – 2025 Q2
A Resilient but Increasingly Uneven Expansion
While headline GDP remained positive during the quarter, macroeconomic signals were mixed and at times contradictory. Consumer spending has been steady throughout the holiday period, although increasingly bifurcated between high- and low-income households. Real (inflation-adjusted) wage growth deteriorated, suggesting that even steady nominal wage increases leave workers struggling to keep pace with inflation.
Wage Growth
Real vs. Nominal Weekly Earnings
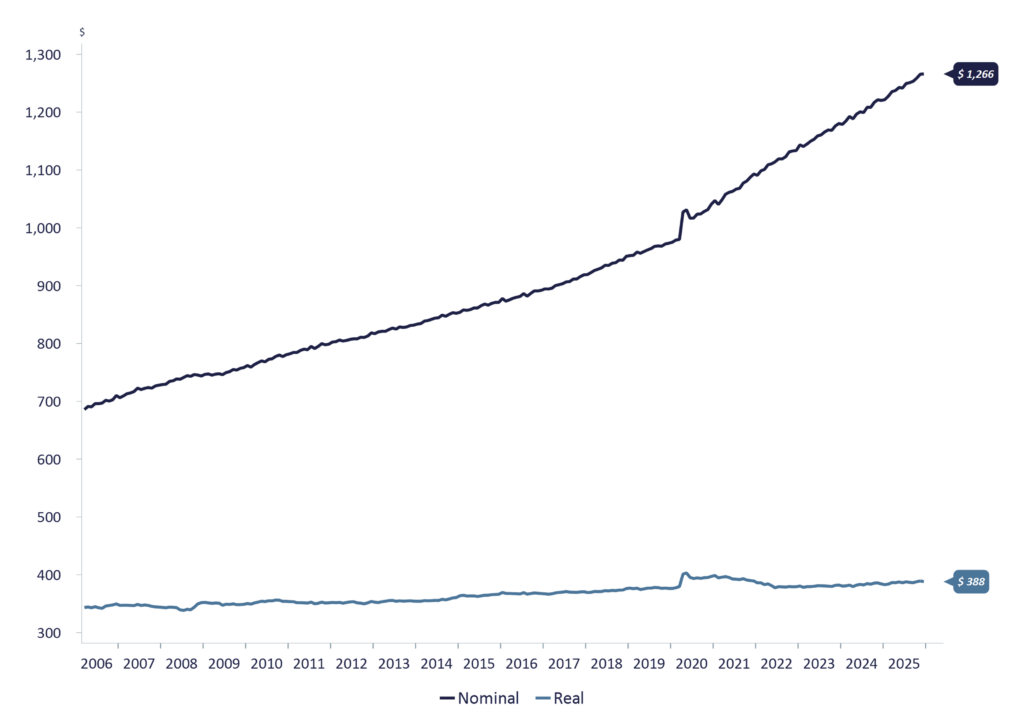
U.S. Bureau of Labor Statistics (BLS), Average Earnings
Monthly data available from March 2006 to November 2025
Businesses also entered a more uncertain phase. Top-line growth remained positive, aided by ongoing productivity improvements, many of which were tied to AI adoption; however, multiple indicators reflect a loss of momentum beneath the surface. On the one hand, firms continue to invest in AI-related infrastructure to avoid being left behind, resulting in significant capital expenditures. On the other hand, questions about the sustainability and concentration of this spending, particularly the market’s heavy reliance of a select few companies, raise concerns that aggregate capital expenditures will soften as companies reassess the pace of AI buildout. These dynamics mirror the broader market rotation observed during the quarter, as investors shifted away from the narrow group that drove returns earlier in the year.
Manufacturing activity contracted for much of the quarter, and business confidence wavered amid shifting tariff policies and uncertainty surrounding the government shutdown.
The shutdown created large blind spots in federal data releases, complicating real-time economic assessments and heightening market sensitivity. With incomplete labor statistics, inflation readings, and household data, investors and policymakers were forced to rely more heavily on private surveys and anecdotal indicators. This heightened the sense of opacity in an economy already showing signs of divergence.
Labor Market Cooling Beneath the Surface
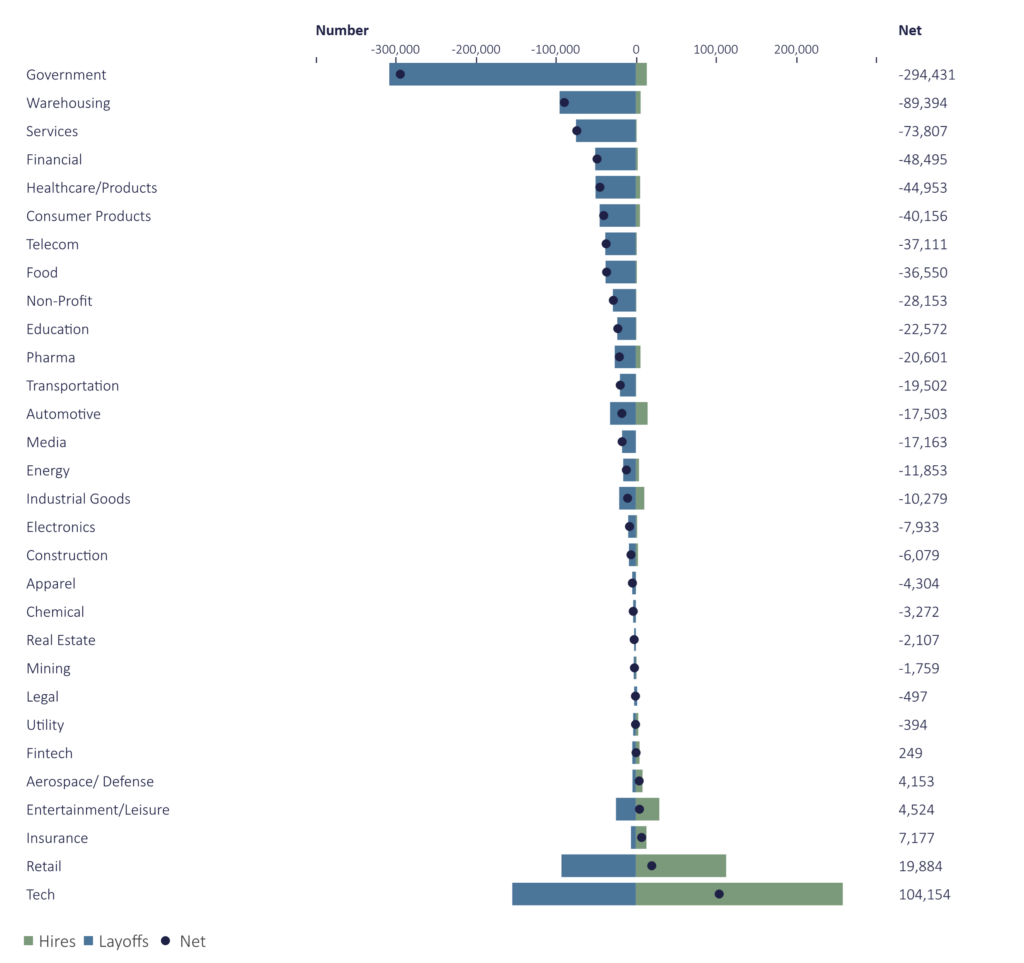
The labor market remains at a key point of transition. Despite low headline unemployment, several underlying indicators weakened throughout the quarter. Continued jobless claims increased, and layoff announcements became more frequent. Hiring slowed noticeably across small businesses, which not only employ nearly half of the US private-sector workforce but also represent the business segment most exposed to higher borrowing costs and tighter credit conditions.
Unemployment rose to a four-year high late in the year, making it increasingly clear that the labor market is cooling. Meanwhile, an elevated youth unemployment rate and fewer employees switching jobs are additional signs of labor-market weakness.
AI-driven productivity gains are real and potentially transformative, but history suggests that economy-wide benefits tend to lag initial adoption. In the current cycle, job displacement may precede job creation, introducing transitional labor market stress even as long-term productivity improves. This timing mismatch carries economic and political implications, reinforcing uncertainty around employment, income growth, and policy responses during the next phase of the expansion. These developments matter not just for employment itself, but also for the economy as a whole.
Challenger Job Layoffs and Hires
January to December 2025
Policy Crosscurrents: Tariff Volatility, Fiscal Instability, and a Changing Fed
Economic conditions were further complicated by ongoing trade policy volatility, including shifting tariff proposals, limited truce periods, and renewed restrictions on strategic materials. These dynamics directly impacted inventory planning and input costs, particularly for manufacturers. At the same time, political gridlock and the government shutdown contributed to fiscal uncertainty, with implications for both consumer confidence and market liquidity.
Monetary policy also remained in flux. The Fed implemented two 25-basis-point cuts during the quarter but signaled a cautious stance given incomplete data and differing views about the proper degree of economic cooling. In addition, upcoming leadership changes at the Fed have raised concerns about its independence and the importance of maintaining its credibility with global investors in managing long-term inflation expectations, potentially affecting interest rates in 2026.
Why Growth Has Persisted – For Now
Despite growing signs of strain beneath the surface, economic growth has remained resilient. One crucial factor is the political and policy backdrop. As the US enters an election year, fiscal and regulatory incentives tend to promote economic growth rather than restraint. Policymakers across the spectrum are incentivized to sustain employment, confidence, and market stability, which contributes to a bias toward continued growth even as longer-term imbalances accumulate.
At the same time, fiscal measures, ranging from targeted tax incentives to investment-related subsidies, have helped offset the lagged effects of higher interest rates. These policies do not eliminate longer-term structural risks related to deficit growth, debt financing costs, and inflation, but merely push them into the future. This dynamic reinforces our view that the current expansion remains intact, though increasingly dependent on policy support and confidence rather than broad-based economic momentum.
Global Forces: Geopolitical Risk, Domestic Outcomes
Overlaying these domestic dynamics is heightened geopolitical risk. Ongoing conflicts, rising protectionism, shifting trade alliances, and the potential for escalation in multiple global flashpoints introduce additional uncertainty. Geopolitical shocks can disrupt supply chains, reprice energy and commodity markets, and rapidly alter inflation and interest rate expectations.
Additionally, the US dollar has weakened over the past year amid a lack of confidence in US fiscal discipline, uncertainty over trade policies, and geopolitical tensions. While a weaker dollar can enhance US export competitiveness and support earnings for US multinationals, we are a nation of importers, and dollar weakness raises import costs and inflation.
A lower dollar may also reduce foreign demand for US assets, thereby increasing longer-term debt-financing pressures. The US government relies heavily on foreign capital to buy US Treasuries. This additional international demand allows the US to finance its debt at a lower rate than it otherwise would.
Entering 2026: A Delicate Balance
The US economy enters 2026 with a unique mix of headwinds and tailwinds. Fiscal stimulus from the OBBB will inject additional momentum through expanded tax refunds, higher take-home pay, and corporate incentives that encourage investment. At the same time, monetary policy has shifted to easing, with lower interest rates and renewed liquidity support following the Fed’s pivot from quantitative tightening. These forces, combined with the political backdrop of a midterm election year, create conditions for an economy that is likely to “run hot” in the near term.
However, growth will increasingly be policy-dependent, and the interplay among fiscal expansion, accommodative monetary policy, and elevated debt levels may exacerbate longer-term economic risks that are merely being pushed further out. Inflation expectations, employment, and geopolitics remain critical variables that could challenge stability. In short, while 2026 begins with strong momentum, the balance between stimulus-driven growth and structural fragility will define the year ahead.
The Equity Market
A Favorable Market Environment
Equity investors enjoyed another year of solid returns in 2025. The S&P 500 and other major indices overcame a dramatic April selloff following the “Liberation Day” tariff announcement and other periodic pullbacks to finish the year near record highs. Analysts currently anticipate double-digit earnings growth in 2026, aided by improving profit margins in sectors that had faced cost pressures. Cooling input-cost inflation (from commodities to wages) and productivity enhancements from new technology investments have begun to support margin recovery for many businesses. These positive fundamentals, combined with fiscal stimulus and the Fed’s shift to lower interest rates, should benefit equities in 2026, helping offset some valuation concerns.
Importantly, market breadth improved as the year progressed. Early in 2025, gains were heavily concentrated in a few mega-cap technology and AI-centric companies. By the fourth quarter, however, the rally had broadened to encompass a wider swath of industries and market-cap tiers, as more companies delivered profit beats and issued upbeat guidance, giving investors confidence in segments beyond the initial tech leaders. Even small- and mid-cap stocks staged a comeback in Q4. Smaller companies tend to benefit disproportionately from a lower interest rate environment, and Fed easing helped alleviate one of the key drags on small-cap valuations. We also note that international equities participated in the upswing, outperforming US stocks while still trading at valuation discounts, partly due to stabilizing global growth and partly to the relative weakness of the US dollar.
Market internals confirm this healthier breadth. The share of total S&P 500 earnings generated outside of the top handful of companies has begun to rise, reflecting profit growth that was no longer exclusively a mega-cap story. We view this development as a healthy evolution. A market supported by many legs is inherently more robust than one balancing on just a few giant companies. It is also encouraging that cyclical areas, such as transportation and semiconductors, and interest-rate-sensitive groups, such as housing-related stocks, showed strength. This pattern has historically preceded durable economic expansions.
S&P 500 Price Returns
S&P Tech Sector vs S&P ex Tech Sector
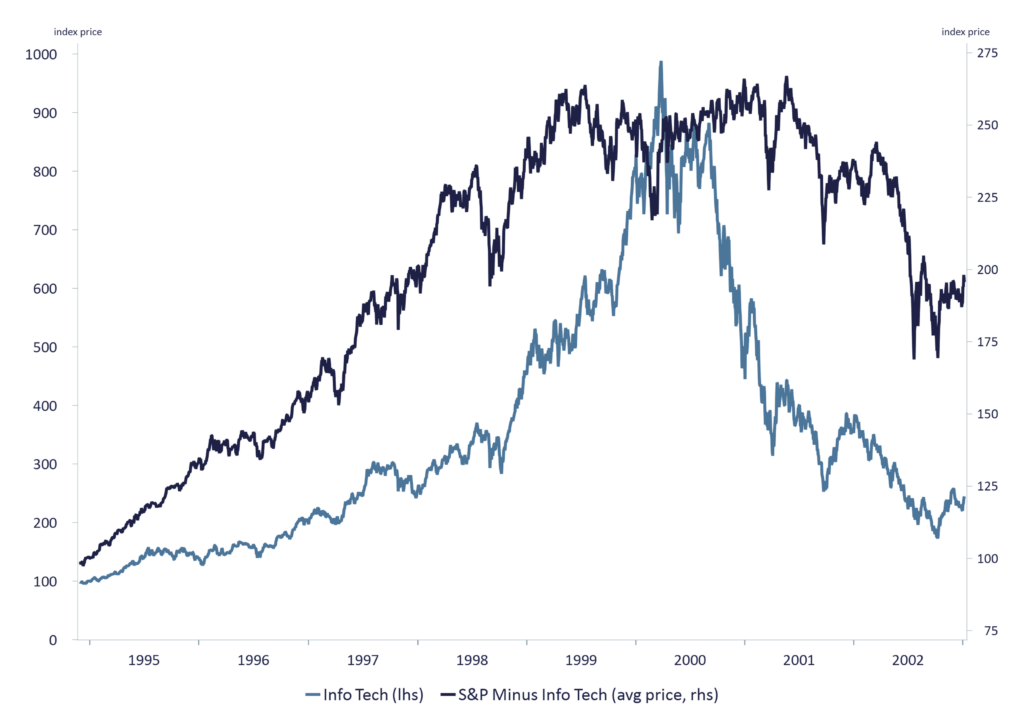
Source: Macrobond S&P Sector Price Indexes
(Info Tech, Consumer Staples + Consumer Discretionary + Industrials + Health Care + Energy + Utilities + Financials + Communication Services + Materials)
Real Estate Sector data not included due to the timeframe
Data: Available daily from 9/11/1989 to 1/7/2026
The Risk of High Valuations
Despite these positive indicators, US equities remain expensive. The S&P 500 closed 2025 trading at roughly 22x consensus forward earnings, well above its 15-year average of 16 to 17×. Price-to-sales and price-to-cash flow multiples are similarly elevated, and market capitalization relative to GDP (the “Buffett indicator”) is near historical highs. These rich valuations underscore that much good news already is priced into stocks.
Stretched valuations heighten the market’s vulnerability to shocks. One immediate concern is higher bond yields. In September, a jump in long-term Treasury yields, driven by concerns about fiscal deficits and Fed policy, triggered a quick 8% pullback in the S&P 500, underscoring that any substantial rise in yields revives the competition between stocks and bonds for investor capital. The appointment of a new dovish Fed chair just as economic growth accelerates, or the Fed turning more hawkish than expected, could spook bond investors and pressure rates higher, weighing on equity valuations.
Another risk is the concentration of ownership and positioning in the largest tech stocks. At one point in 2025, the top 10 US companies accounted for almost a quarter of the total global equity market cap. Should those market darlings stumble, whether due to an earnings miss, a regulatory action, or a shift in investor sentiment, the broader indexes could be dragged down. We saw a microcosm of this in an early 2025 episode when a new AI competitor emerged, leading to a sharp selloff in a few mega-cap tech names, dragging the S&P 500 down about 8%; notably, though, defensive sectors actually rose. Elevated valuations and current low volatility in the market lead us to expect exaggerated market reactions to news, whether good or bad, in 2026.
It is worth noting that investor sentiment is not euphoric, which is positive from a contrarian perspective. Investors added to equity exposure only cautiously in 2025, with many still holding more cash or fixed income. This suggests we have not reached the kind of exuberant over-positioning that often precedes major tops. Nonetheless, our expectation is for moderate returns going forward. With equities starting from a high valuation base, gains likely will have to rely on earnings growth rather than further multiple expansion to drive returns. Therefore, we are placing greater emphasis on earnings quality and growth durability in our stock selection, seeking companies that can deliver in an environment where easy valuation-driven gains largely have been realized.
AI Productivity Promise – Patience Required
One of the defining market themes of the past two years has been enthusiasm for AI and excitement over its potential, which fueled significant multiple expansion in technology stocks and was a key driver of robust equity gains. We are now at a juncture where questions about the tangible impact of AI on corporate performance and the broader economy are taking center stage, with a greater focus on “proof of profitability” from AI investments.
Thus far, the promise of AI remains far more visible than its quantifiable impact. Corporate America is investing heavily in AI capabilities, and this spending has fueled a boom in tech capital expenditures, benefiting companies that supply the hardware, software, and services needed. However, stock valuations for AI-exposed companies have leaped higher in anticipation of future growth, while real-world productivity gains from AI are only beginning to materialize.
From an economic standpoint, we remain long-term believers that AI and related technologies will unlock meaningful productivity improvements. However, we also recognize we are in the early innings of that transformation, and a broad-based productivity surge attributable to AI has not yet emerged in the data, which is not surprising.
For investors, this means the AI investment theme may require patience and selectivity. Not every company touting an AI focus will be a long-term winner, and some business models could be disrupted even as others are enhanced. We continue to favor a selective approach: participating in AI investments through well-established companies with clear strategies and competitive advantages, while avoiding the more speculative fringe, where valuations are hardest to justify. We also note that AI benefits will extend beyond the tech sector. We are looking for opportunities in industries such as healthcare, industrials, and financial services, where applying AI could lead to cost reductions, beneficial outcomes, or new revenue streams.
Fixed Income
A Market Transitioning Toward a Steeper Curve
As the Fed eases its policy stance and short-term yields decline, the yield curve has begun to steepen modestly, with long-term rates supported by persistent fiscal deficits, elevated Treasury issuance, and uncertainty about inflation. A steeper yield curve, driven more by long-end dynamics than by the Fed’s near-term actions, is likely to shape credit conditions into 2026. This combination suggests that with rates well above pre-pandemic lows, income opportunities across high-quality fixed income remain decent.
Long-Term Rates Anchored by Global and Domestic Forces
The US bond market remains the largest and most liquid bond market in the world, a factor that has kept long-term rates relatively tame.
However, the persistence of large federal deficits, rising federal debt, and increasing debt-service costs cannot be ignored. These structural forces suggest that long-term rates may remain sticky, even as the Fed continues to ease.
Beyond structural deficits and rising debt-service costs, global dynamics are adding complexity. The carry trade has been a popular strategy for years, whereby investors profit from borrowing in Japanese yen at ultra-low interest rates to invest in higher-yielding assets such as US Treasuries, thereby amplifying demand for those assets. In addition, Japan is the largest international holder of US Treasuries. Over the last 2 years, rates on Japanese government bonds have risen by approximately 125%. While they remain below US rates, the differential has narrowed considerably, which could eventually reduce demand for US Treasuries and result in higher yields. Similarly, increased ownership by hedge funds underscores the growing role of leveraged strategies in Treasury markets, which can unwind quite quickly. Finally, the US Treasury is shifting issuance towards shorter‑term bills to fund the ever-increasing deficit, which will necessitate more frequent refinancing and less predictable debt‑service costs.
US Debt Ownership Changes
Major Foreign Holdings Over Time
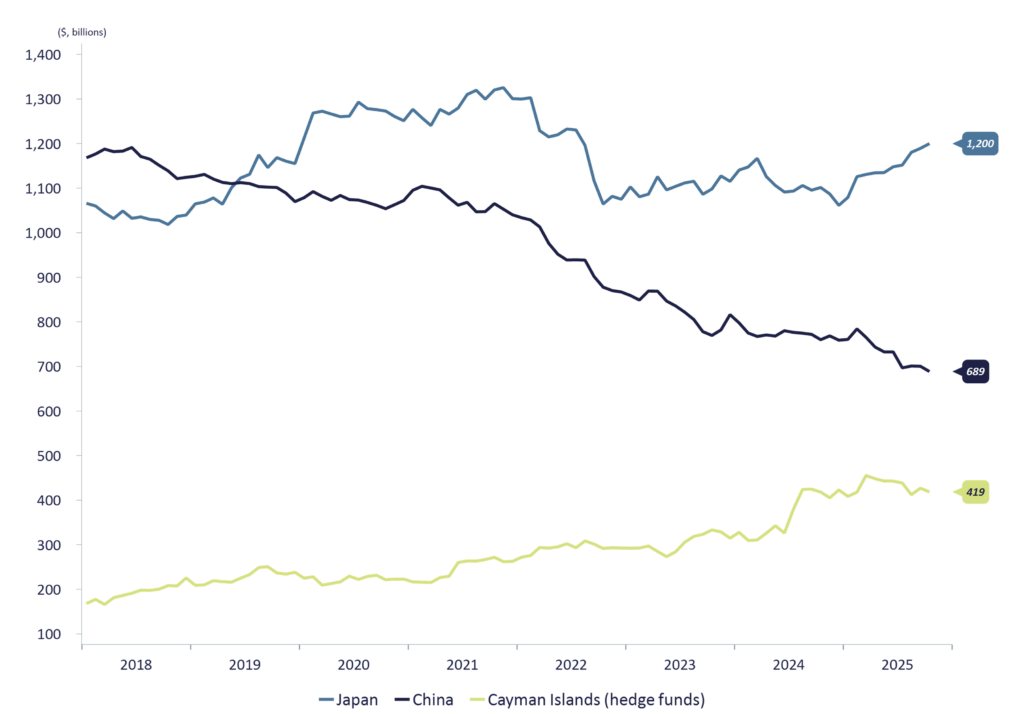
Source: Bloomberg, US Treasury Securities Foreign Holders
Data: Available monthly 3/2000 to 10/2025
Credit Markets: Liquidity Improves, But Quality Diverges
Liquidity within public fixed-income markets improved as the Fed ended quantitative tightening earlier than expected and resumed Treasury bill purchases the following month, effectively a new round of quantitative easing. Yet beneath this improvement lies an increasingly divergent credit landscape.
Investment-grade corporates continued to benefit from strong balance sheets, low refinancing needs, and wide investor demand for high-quality income. At the same time, more-leveraged companies faced rising refinancing pressure, an issue likely to intensify into 2026 as higher-coupon legacy bonds mature.
On the other hand, private credit continues to expand rapidly, creating opportunity but also the potential for rising systemic risk. Concerns center on opacity, increased leverage, and late-cycle behaviors reminiscent of those seen in the pre-2008 period.
While the overall credit environment remains stable, emerging pockets of vulnerability are appearing, particularly among borrowers who had relied on low-cost financing earlier in the cycle and must now navigate a materially higher interest rate environment.
Municipal Credit: Stability with Increasing Caution
Municipal bond markets remained well-supported through 2025, although signs of stress began to surface. States and municipalities benefited from still-healthy rainy-day funds and resilient tax revenues; however, concerns regarding credit quality, especially in regions facing slowing population growth, rising pension obligations, or post-pandemic budget pressures, have become more prominent.
With issuance expected to remain uneven across different jurisdictions, and valuations still rich relative to Treasuries, we believe selectivity in buying is increasingly essential. High-quality issuers with stable revenues to support their bonds remain attractive, but credit analysis will be necessary as fiscal conditions tighten.
Corporate Issuance and the Cost of Capital: A New Phase
After a period of heavy issuance to fund AI-related expansion and Capex, companies may face more constrained funding conditions in the coming year. With long-term yields expected to remain sticky and investors becoming more discerning, the cost of funding AI innovation may rise. Big tech firms used to rely primarily on massive cash flow to fund Capex spending. However, in 2025, roughly $120 billion of debt, a record amount, was issued by companies to fund AI-related capital expenditures. Of the total, the vast majority, $90 billion, was issued in the fourth quarter alone by 5 mega-cap tech companies: Microsoft, Amazon, Alphabet, Meta, and Oracle.
Debt markets will remain open to high-quality issuers, but the bar for accessing capital at attractive terms is expected to climb. For highly-leveraged companies, or those with business models that depend on cheap financing, 2026 could present significant challenges if investors grow increasingly skeptical of debt-fueled AI spending.
Income Opportunities Improve as Real Yields Normalize
For investors who have had to rely more heavily on equities for income over the past decade, fixed income has become a meaningful contributor to both cash flow and portfolio stability since the Fed started raising rates in 2022. Positive real yields across Treasuries, high-quality corporates, and select municipal bonds offer the opportunity to generate income while reinforcing diversification, particularly if volatility increases for risk assets.
A Changing Regulatory and Monetary Landscape
The new year will bring new leadership at the Fed, and markets will closely watch how the new Fed Chair will strike the balance between inflation and labor markets while navigating a White House that wants significantly lower rates and is making it a job requirement. Fed independence remains a critical keystone to maintaining its credibility and effectiveness, and any perception of political influence that leads to policy mistakes could swiftly affect investor appetite for US Treasuries and, in turn, bond yields and broader credit conditions.
Closing Thoughts
As we ring in a new year, investors face an environment defined by many of the same issues they faced a year ago: high valuations, market concentration, and large amounts of capex for AI-related projects. Economic growth continues to be supported by productivity gains and selective consumer strength, but it is about to be boosted by significant fiscal stimulus. Yet underlying divergences among households, across industries, and across parts of the labor market have become more pronounced. These imbalances do not signal an imminent downturn, but they do suggest that the economic outlook may be more fragile than it seems on the surface.
At the same time, if bond yields remain stable, double-digit corporate earnings growth and massive fiscal stimulus should serve as tailwinds to markets in the coming year.
We wish you and your family a happy and healthy 2026.
The information provided here is for general informational purposes only and should not be considered an individualized recommendation or personalized investment advice. No part of this material may be reproduced in any form, or referred to in any other publication, without the express written permission of 1919 Investment Counsel, LLC (“1919”). This material contains statements of opinion and belief. Any views expressed herein are those of 1919 as of the date indicated, are based on information available to 1919 as of such date, and are subject to change, without notice, based on market and other conditions. There is no guarantee that the trends discussed herein will continue, or that forward-looking statements and forecasts will materialize.
This material has not been reviewed or endorsed by regulatory agencies. Third party information contained herein has been obtained from sources believed to be reliable, but not guaranteed.
1919 Investment Counsel, LLC is a registered investment advisor with the U.S. Securities and Exchange Commission. 1919 Investment Counsel, LLC, a subsidiary of Stifel Financial Corp., is a trademark in the United States. 1919 Investment Counsel, LLC, One South Street, Suite 2500, Baltimore, MD 21202. ©2026, 1919 Investment Counsel, LLC. MM-00002208