










Investment Review & Outlook - July 2026

Looking Past the Fog: Resilience Amid Crosscurrents
Key Takeaways
- The conflict involving Iran dominated the quarter and triggered one of the largest oil supply shocks since World War II. Progress toward a peace agreement has helped oil prices ease, but a lingering risk premium could keep energy prices elevated and inflation stickier for longer than expected.
- While valuations remain elevated, particularly for companies benefiting from AI infrastructure spending, recent stock gains have been driven by earnings growth rather than multiple expansion, providing a more durable foundation for future returns. Uncertainty ahead of the midterms and the prospect of higher interest rates are potential risks to stocks.
- With inflation still elevated, markets are now pricing in the possibility of rate hikes later this year or early 2027. Inflation remains the key swing factor for the rate outlook. A new Fed Chair, Kevin Warsh, adds an additional layer of policy uncertainty as he faces pressure to ease policy even while the economy and labor market remain solid. Importantly, however, monetary policy remains committee-driven.
| QTD Return | YTD Return | Price/Value | |
|---|---|---|---|
| Dow Jones Industrial Average | 13.4% | 9.8% | 52,319 |
| S&P 500 | 15.2% | 10.2% | 7,499 |
| S&P 500 Equal-Weighted | 11.4% | 12.1% | 8,627 |
| Bloomberg US 2000 | 21.0% | 23.0% | 2,076 |
| MSCI EAFE | 11.1% | 9.8% | 3,117 |
| MSCI EM (Emerging Markets) | 24.1% | 24.0% | 1,723 |
| Bloomberg US Aggregate | 0.7% | 0.6% | 93 |
| Bloomberg Municipal Bond | 2.5% | 2.3% | 103 |
| Gold (NYM $/ozt) Continuous | -13.7% | -7.0% | $4,039 |
| Crude Oil WTI (NYM $/bbl) Continous | -32.4% | 21.0% | $69 |
Economy
Resilient Growth Amid an Energy Shock
The U.S. economy remains remarkably resilient, demonstrating notable strength despite the energy shock from the Iran conflict. Capital expenditures are rising, corporate profits continue to grow at an impressive pace, and the labor market is showing signs of renewed strength. Together, these factors have helped the economy absorb higher oil prices without losing momentum.
Real GDP growth in the most recent quarter was 2.1%, driven largely by a surge in AI-related capital investment. Notably, business investment overtook consumer spending as the primary engine of U.S. economic growth, contributing more than half of overall GDP growth. AI investments by hyperscalers are expected to increase by nearly 40% to approximately $1 trillion next year, providing meaningful support for continued expansion. That said, there is growing concern about how long spending can continue at this pace; any slowdown would have broader implications for overall economic growth and AI-related stock valuations.
While consumer spending remained positive, it recently slowed as households faced higher oil prices. Larger tax refunds from recent legislation, initially expected to boost consumer spending, helped partially offset the drag from elevated energy costs.
With the oil price shock expected to fade in the second half of the year, and AI-related investment continuing to provide support, the economy should remain on solid footing, with current estimates pointing to 2-2.5% growth.
Consumers and AI are Powering Domestic Demand
Contributions to q/q growth in final domestic demand (pp)
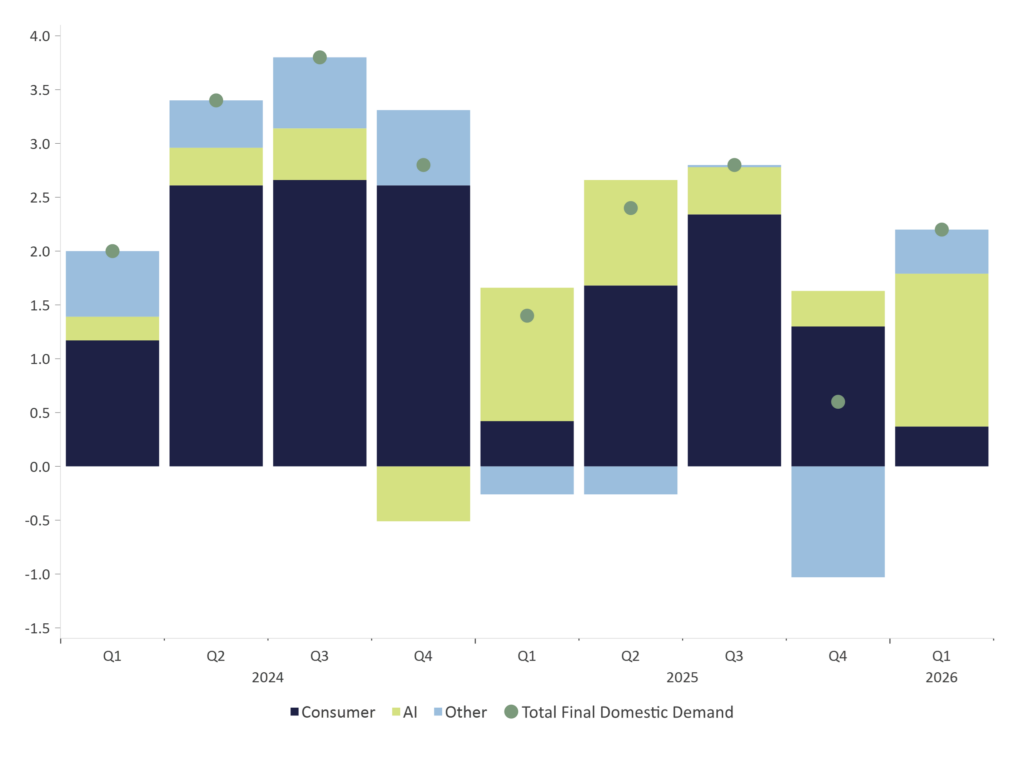
Source: Bloomberg (GDP PCE, GDP NONR, FSDPCHA Indexes)
Total nonresidential fixed investment includes Data Centers, Compute/Hardware, and Software/R&D
Data: Available quarterly from 2024 Q1 – 2026 Q1
Capex Spending Among Hyperscalers
Leading companies have drastically upped their AI spending and continue to increase their estimates
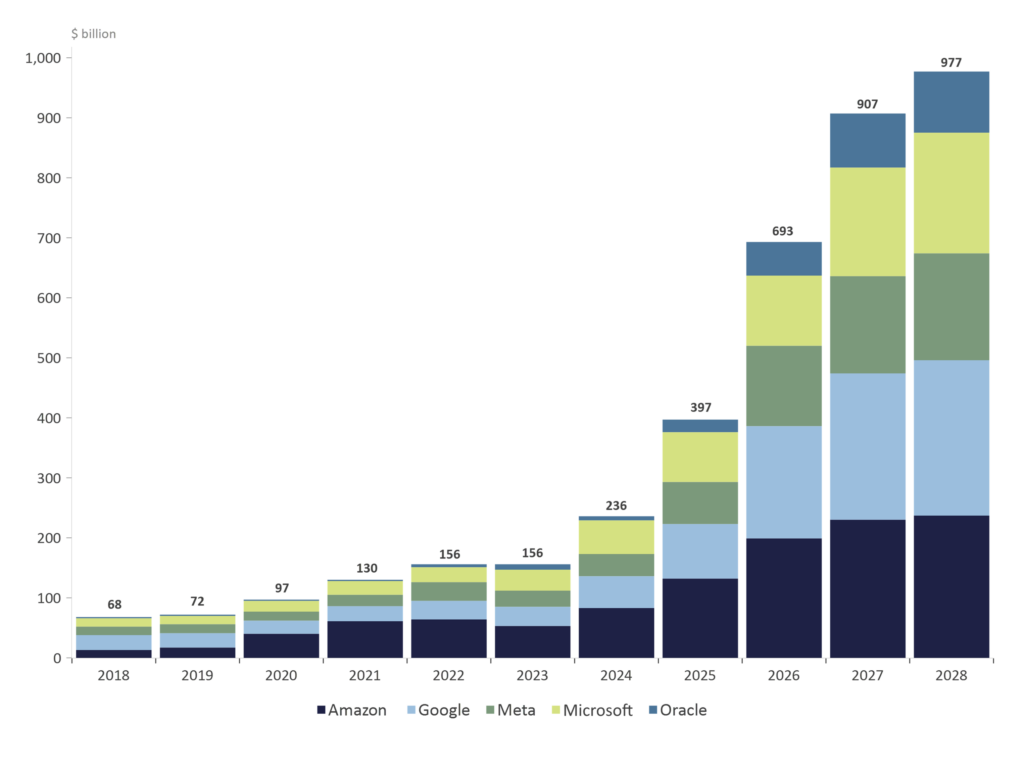
Source: Bloomberg (company filings)
2026/2027 include consensus estimates & company guidance
Data: Annual from 2018-2028e
Consumer: Stable but Showing Signs of Strain
American consumers, who account for roughly 68% of the U.S. economy, continue to spend at a solid pace but are starting to show signs of strain. While the relatively stable labor market has provided support, incomes have not kept pace with spending, prompting consumers to tap savings and credit cards, a behavior typically seen in periods of economic stress.
Consumer sentiment hit a record low in May but has since improved as gasoline prices have declined. Still, the bifurcation in the U.S. consumer remains clear. Higher-income households continue to benefit from rising asset values and remain an important support for broader spending. However, that strength also makes consumption more vulnerable to an equity market pullback.
Low- and middle-income households, by contrast, are under increasing pressure from higher food and energy costs. The personal savings rate has fallen to 2.6%, near historic lows, as expenses have outpaced income. As shown in the chart below, costs for everyday items, such as food, energy, and shelter, have outpaced earnings for the last five years. With costs rising faster than income and savings close to depletion, consumers are relying more heavily on credit, with U.S. household debt at a record $18.8 trillion. Tax refunds from the OBBBA have helped offset some of this pressure, but that support will fade in the second half of the year.
Common Man CPI vs. Hourly Earnings
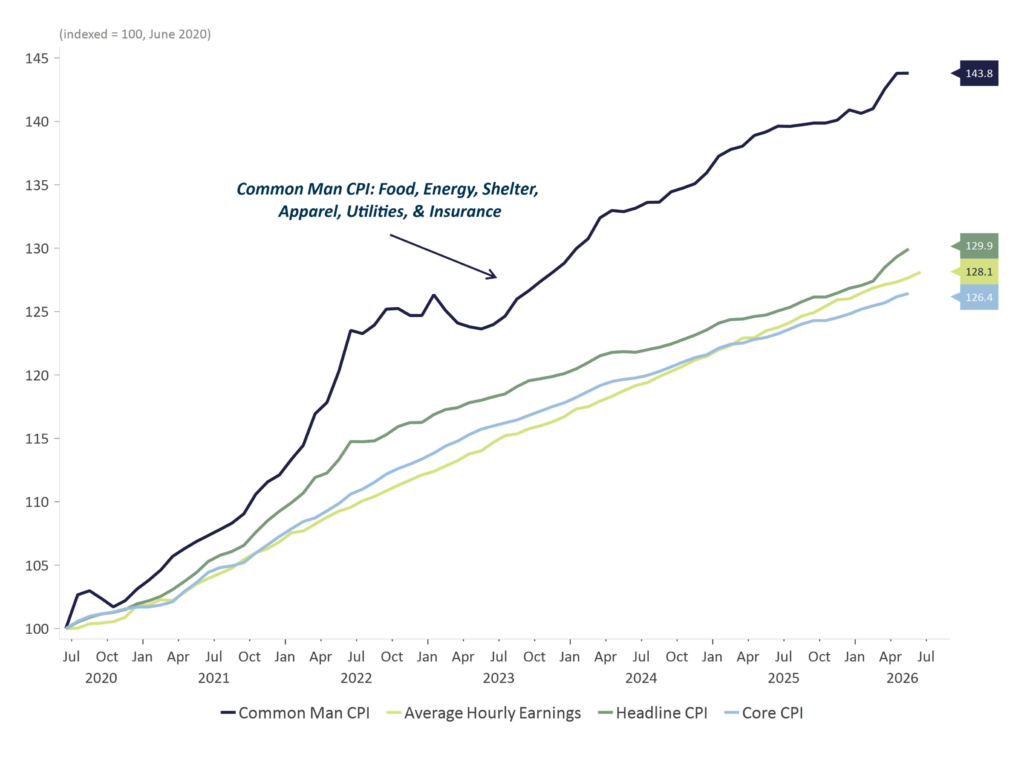
Source: Macrobond, U.S. Bureau of Labor Statistics, Strategas
Utilities includes Electricity & Utility Piped Gas, Insurance includes Health & Motor Vehicle
Data: Available monthly from 3/2026 – 6/2026, last updated 6/2026
After softening late last year, the labor market has stabilized and even improved modestly. Unemployment claims remain low, consistent with the “low-hire, low-fire” dynamic that has characterized this cycle. Employment growth has increased since the start of the year, while job openings have risen to the highest level in two years.
Although concerns remain that AI could displace workers, history suggests that technological innovation is ultimately a net job creator. By lowering barriers to starting and scaling businesses, AI is accelerating new company formation, particularly in AI-enabled sectors (see chart below). Additionally, hiring for recent college graduates has begun to improve, suggesting early signs of recovery in entry-level employment.
Business Applications
United States business applications are rising faster for growth companies, likely driven by AI
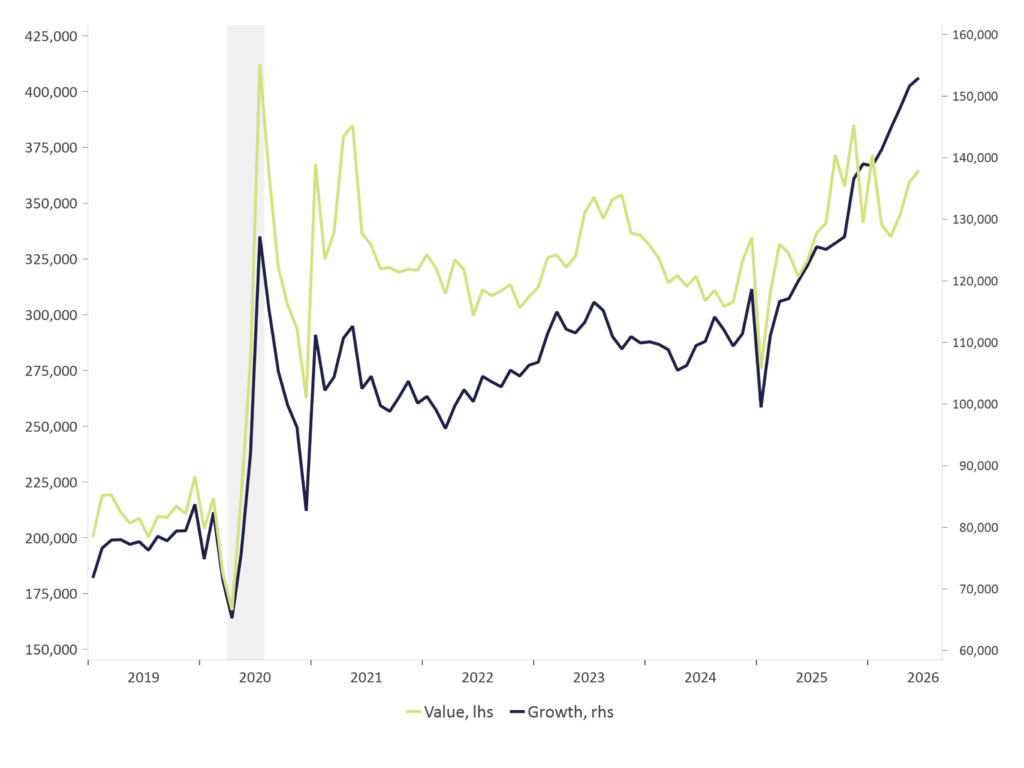
Source: Macrobond, U.S. Census Bureau, Business Applications
Value Companies include: Retail Trade, Finance & Insurance, Utilities, Mining, Manufacturing, Transportation & Warehousing, Construction, Real Estate, Wholesale Trade, Accommodation & Food Services, Administrative & Support, Other Services, Management of Companies, Agriculture
Growth Companies include: Information, Professional Services, Healthcare & Social Assistance, Educational Services, Arts & Entertainment
Data: Available monthly from 7/2004 – 6/2026, last updated 7/9/2026
Inflation: Sticky, with Energy in Focus
Even before the start of the war, inflation was running above the Fed’s 2% target, but headline inflation moved sharply higher over the past three months, driven largely by higher gasoline prices. Beneath the surface, even excluding energy, inflation remains sticky and has continued to edge higher.
Goods prices have been rising, likely reflecting the pass-through cost of tariffs, while services inflation, which accounts for roughly 60% of core inflation, has been accelerating as well. Electricity prices are surging, partly due to increased demand from AI data centers, and housing inflation remains elevated. The increase in services’ inflation would likely be higher, except that wage growth for service-industry workers has remained fairly moderate.
Headline inflation should decline as gasoline prices ease, but several underlying drivers suggest that returning to the Fed’s 2% target may prove challenging, nonetheless. Oil inventories have been drawn down and will need to be replenished by end users and the government-controlled strategic reserves. On the production side, damaged infrastructure will need to be rebuilt, and countries that curtailed output during the conflict will require new drilling and investment to restore supply, a process that could take several months to years.
Inflation Breakdown
Components of Year Over Year Change in Consumer Price Index
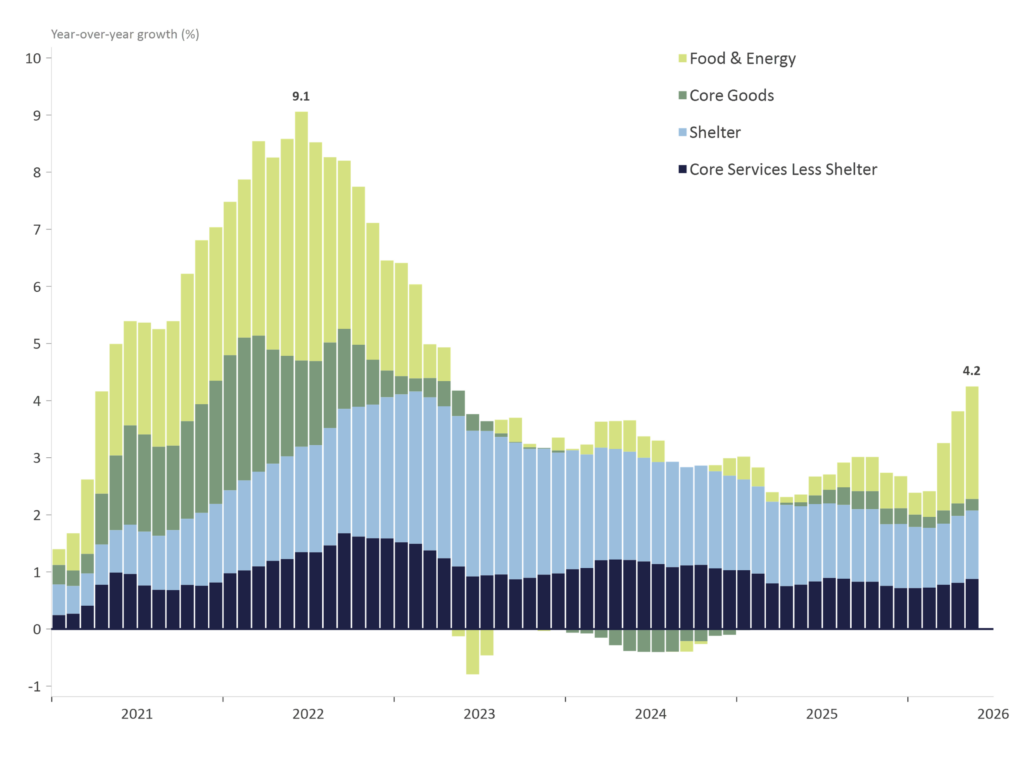
U.S. Bureau of Labor Statistics (BLS), CPI, Seasonally Adjusted Effects
Monthly data available from March 2012 to May 2026, last release on Wednesday, June 10, 2026
Artificial Intelligence
Beyond the Hype: Productivity and Broadening Adoption
Beyond driving market performance and capital investment, artificial intelligence is increasingly shaping the real economy. The emergence of agentic AI (systems capable of completing complex, multi-step tasks with limited human oversight) has the potential to deliver meaningful productivity gains over time. Importantly, adoption is broadening well beyond the technology sector, with companies in healthcare, financial services, manufacturing, and other industries beginning to embed AI into their operations.
At the same time, pushback against AI and data center development is growing nationwide and becoming a more visible political issue. As the midterm elections near, voters are increasingly expressing concerns about AI’s impact on jobs, energy demand, electricity costs, water resources, and climate change.
Equity Markets
Earnings Strength Meets Concentration
Corporate earnings have been the primary engine of year-to-date equity returns, and that engine remains strong. Earnings grew 28% in the first quarter, the fastest pace since 2021 and the sixth consecutive quarter of double-digit growth. Analysts continue to raise EPS estimates for the remainder of 2026 and into 2027, with current expectations calling for roughly 24% full-year earnings growth. Importantly, gains driven by earnings growth, versus valuation expansion, provide a healthier foundation for the market.
2025 vs. 2026 vs. 2027
S&P 500 EPS Progression
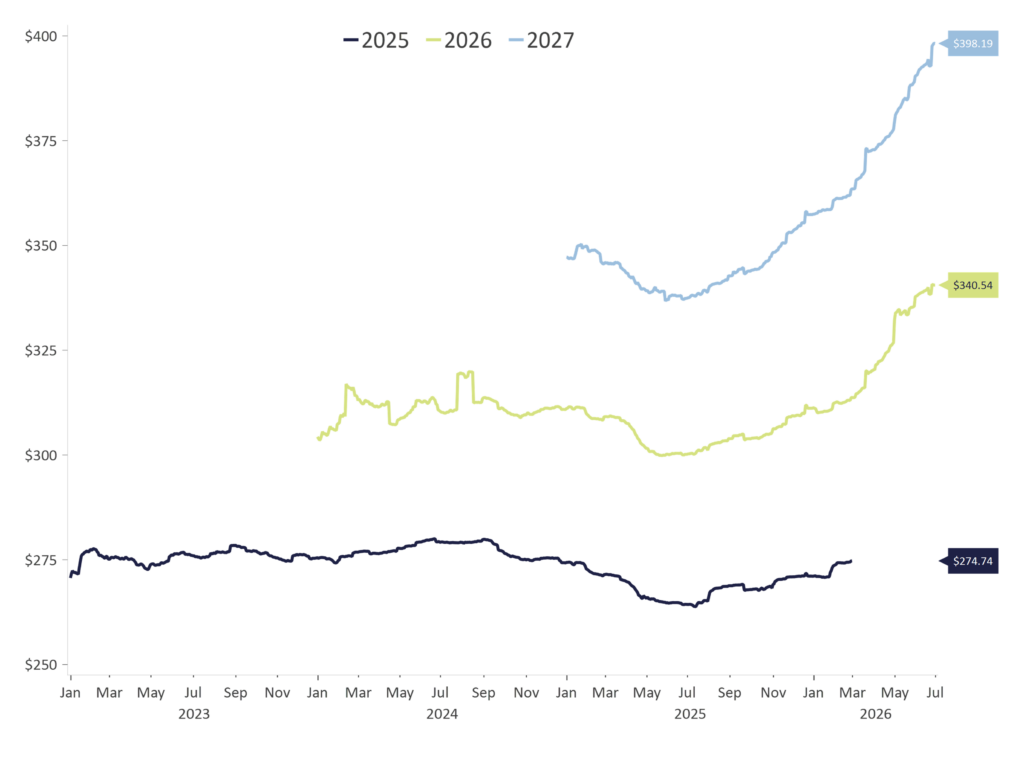
Source: Factset Market Aggregates, Macrobond
Data: Daily from 1/1/2023 – 6/30/2026
Encouragingly, earnings growth is also broadening beyond mega-cap technology. Non-tech sectors of the S&P 500 are expected to see stronger earnings growth in 2026 and 2027, while growth among mega-cap tech companies begins to decelerate. Small-cap company earnings are also expected to rebound, which should support their stocks’ performance.
One caveat is that first-quarter profits were boosted by accounting gains at a handful of companies, including Alphabet, Amazon, and Nvidia. Their stakes in private AI companies such as Anthropic and OpenAI were marked higher following new funding rounds at increased valuations. While these gains meaningfully lifted reported S&P 500 profits, they were largely non-cash and should be viewed as less durable than underlying operating earnings.
Concentration and the AI Trade
Market leadership remains highly concentrated, with the top 10 companies accounting for 38% of the S&P 500 index’s value, roughly double the share in prior decades. For the last three years, the market has been heavily dominated by technology and technology-adjacent stocks, which now make up over 50% of the S&P 500’s market capitalization, leaving the broader market increasingly exposed to abrupt changes in trends and investor sentiment in technology and AI.
For most of the second quarter, performance was driven by technology, with semiconductor and AI-related companies at the forefront. Semiconductor stocks returned 88% in just three months, and the industry now represents roughly 19% of the S&P 500, half of the technology sector, and larger than the entire financials sector.
Encouragingly, market breadth began to improve in late June, with small- and mid-cap stocks, the equal-weighted S&P 500, and more moderately-valued sectors outperforming technology. Technology came under pressure amid growing concerns about the scale of AI-related spending and the increased amount of debt issuance required to fund it (see chart below), as free cash flow for these companies has declined.
Estimated Net Debt Trajectory of Hyperscalers
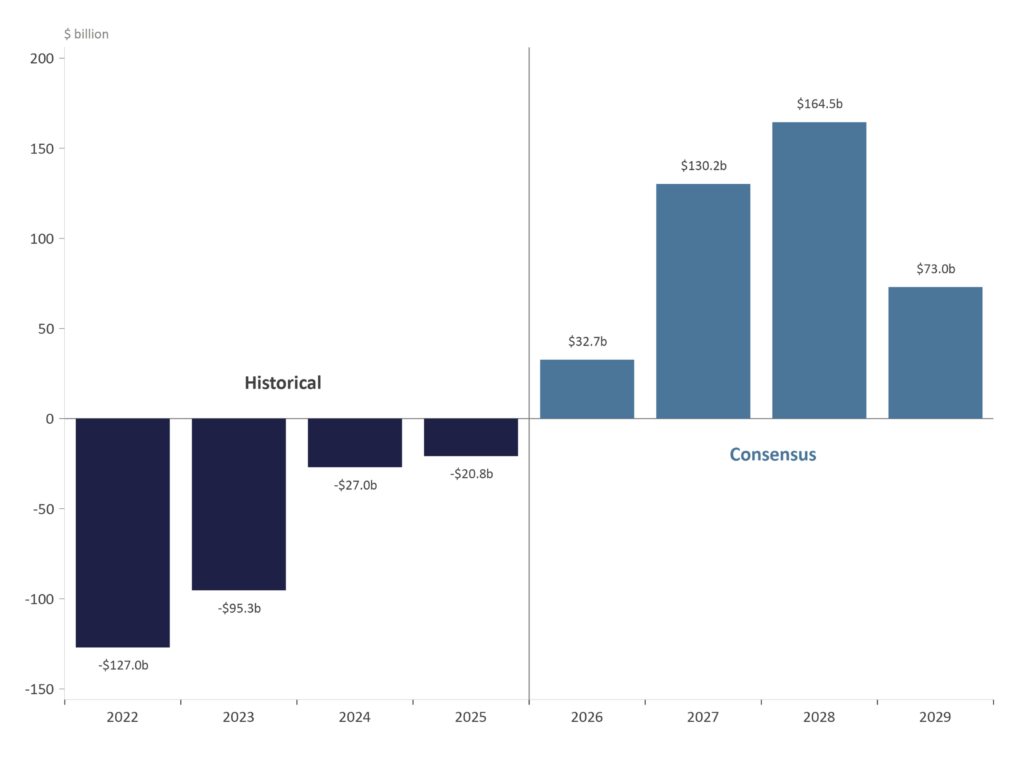
Source: Bloomberg, Sofi
Hyperscalers include AMZN, GOOG, META, MSFT, and ORCL
Data: Available annually from 2022-2029
Hyperscalers’ Cash Flow and Capex
As a % of sales revenue
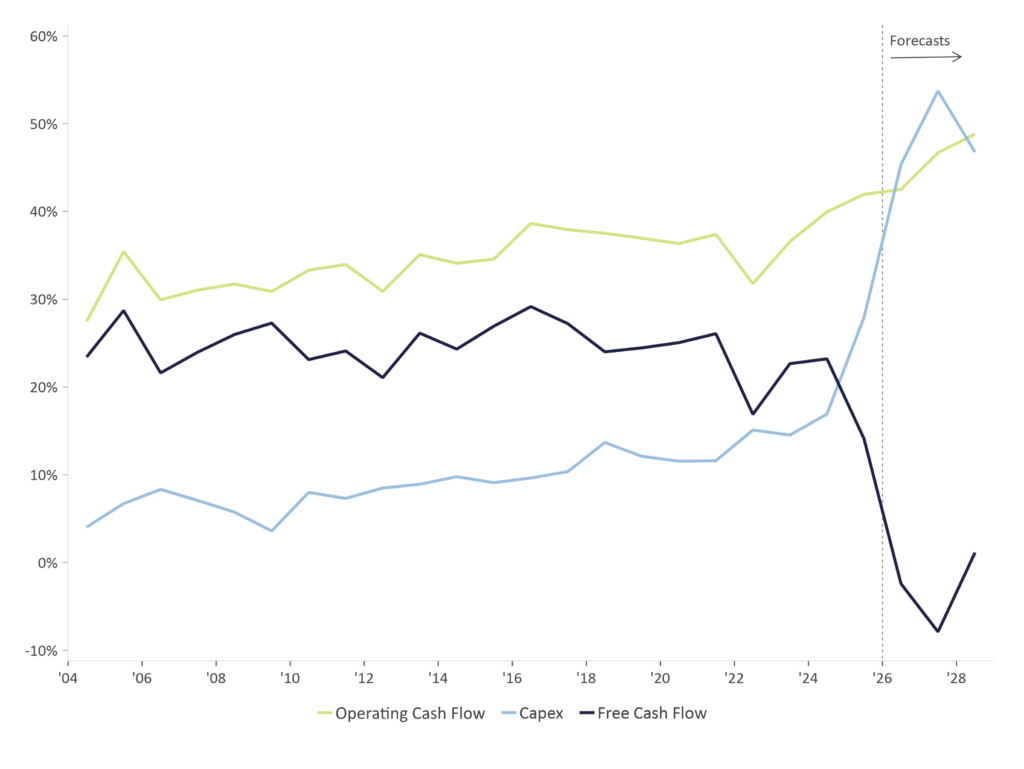
Source: Bloomberg (company filings and consensus estimates)
Data: Available annually from 2004-2028e
A Wave of Mega-Cap Supply
After several years of subdued IPO activity, 2026 is expected to bring a significant wave of new equity supply, totaling roughly $260 billion. This includes the recent SpaceX $86 billion IPO as well as a potential IPO from Anthropic. OpenAI, initially expected to IPO this fall, may delay its offering until 2027 amid recent tech volatility and the lackluster performance of other mega-cap listings, including SpaceX. Notably, even Alphabet, a company with over $64bn in free cash flow and profits of over $160bn, raised $85bn in equity recently to continue financing its AI investments.
The scale of these offerings is notable. SpaceX’s IPO was the largest in history, with a total company market value of approximately $1.8 trillion and a valuation of nearly 100x forward revenue, implying growth assumptions that would require extraordinary execution. Additionally, the governance structure warrants scrutiny, as Elon Musk (Chairman, Chief Executive Officer, and Chief Technology Officer) retains approximately 82-85% of voting control, an unprecedented level for a public company of its size. Additionally, a lack of an independent board of directors is also disconcerting, as are other provisions that translate to minimal accountability to public shareholders.
Increase in Leverage in Equity Markets
An additional risk may be building beneath the surface of the equity market, as rising leverage, a growing number of leveraged ETFs, and options trading increasingly amplify price moves in both directions. U.S. margin debt rose 54% to a record $1.4 trillion in May, while assets in tech ETFs and high-risk leveraged ETFs have grown rapidly.
Cumulative Sector ETF Flows
Since March 30th, S&P 500 Low
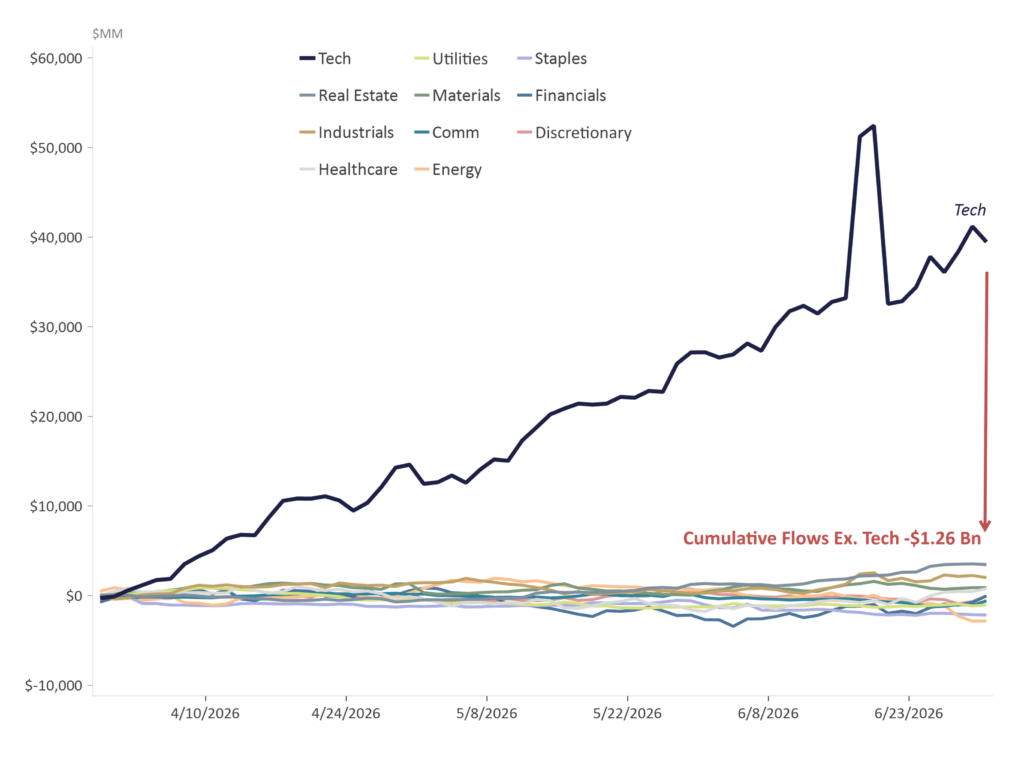
Source: Macrobond, Strategas
Data: Available daily from 3/30/2026 to 6/30/2026
Retail investors have been key participants, increasingly using margin to buy options on leveraged ETFs, creating multiple layers of embedded leverage. Assets in these products have nearly doubled since the end of March, driving greater demand for derivatives tied to individual stocks and indices. With retail investors representing roughly 92% of holders, there is concern that many may not fully appreciate the risks associated with these strategies.
This growth has also increased demand for the underlying securities, as market makers buy shares to hedge derivative exposure. While this dynamic has helped fuel outsized gains in certain areas, it could also intensify losses in a downturn. As prices fall, forced deleveraging and hedging activity can accelerate selling pressure, creating a negative feedback loop. Last month, a popular 3x-leveraged semiconductor ETF fell 31% in a single day, roughly triple the decline of its benchmark. If volatility rises, these products could contribute to even larger swings in certain parts of the market.
ETF Flows Continue at Remarkable Pace
Total assets in leveraged ETFs
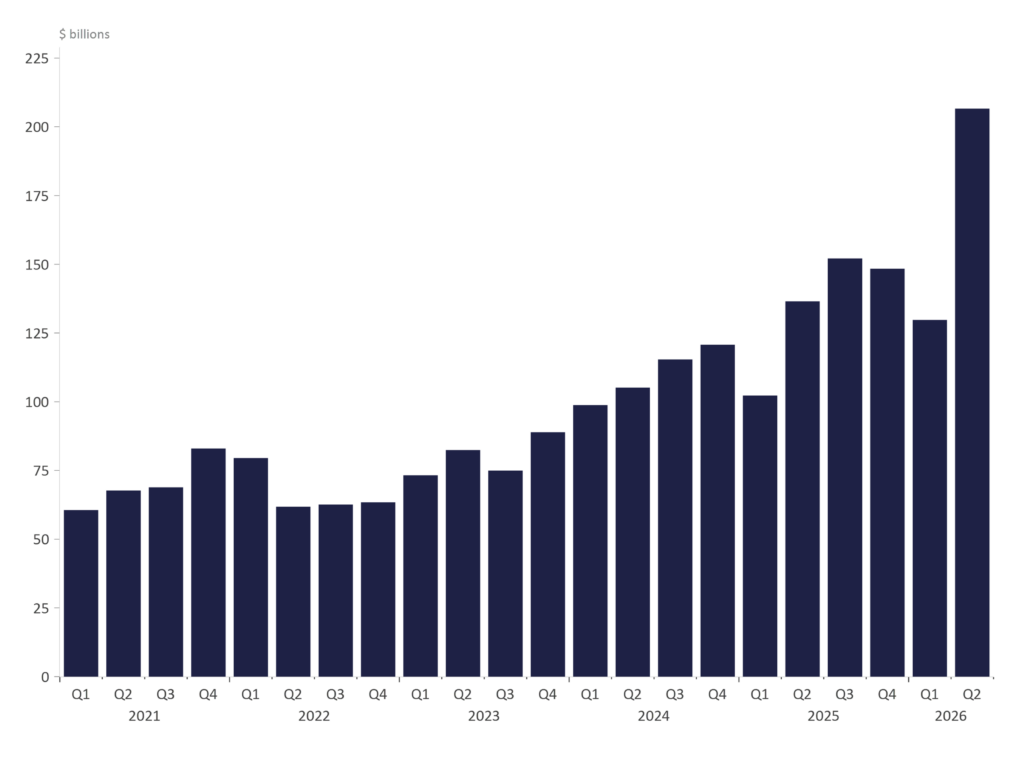
Source: Bloomberg (U.S. Listed Exchange-Traded Funds only)
Data: Available quarterly from 2021 Q1 – 2026 Q2
Fixed Income
Higher Yields Meet New Leadership
The Federal Reserve: New Leadership, New Uncertainty
A change at the top of the Fed has introduced additional uncertainty into the policy outlook. Newly appointed Chair Warsh faces the challenge of balancing political pressure to lower interest rates against a resilient economy, a solid labor market, and still-elevated inflation. It is important to remember that Fed policy is committee-driven and not decided solely by the Fed Chair. Notably, at his first FOMC meeting, Fed Chair Warsh reaffirmed the Committee’s commitment to price stability, prioritizing combating inflation over maximum employment at this time.
He also signaled an appetite for broader institutional reforms, including reducing the Fed balance sheet and returning to pre-Global Financial Crisis communication norms. To that end, he established five task forces to review Fed communications and forward guidance, balance sheet policy, the use of economic data, the impact of productivity-enhancing technologies such as artificial intelligence on employment, and the central bank’s broader policy framework. Importantly, the Fed’s 2% inflation target is not under review.
The Bond Market: Yields Reset Higher
Sticky inflation has introduced the possibility of rate hikes, causing yields to move higher across all maturities. This is a notable shift from the rate cuts the market had been pricing in before the conflict. However, assuming oil starts flowing through the Strait of Hormuz again and long-term inflation expectations remain well anchored, rate hikes are likely off the table for now.
Yield on Treasuries
Nominal and Real 10-Year Treasury Rate
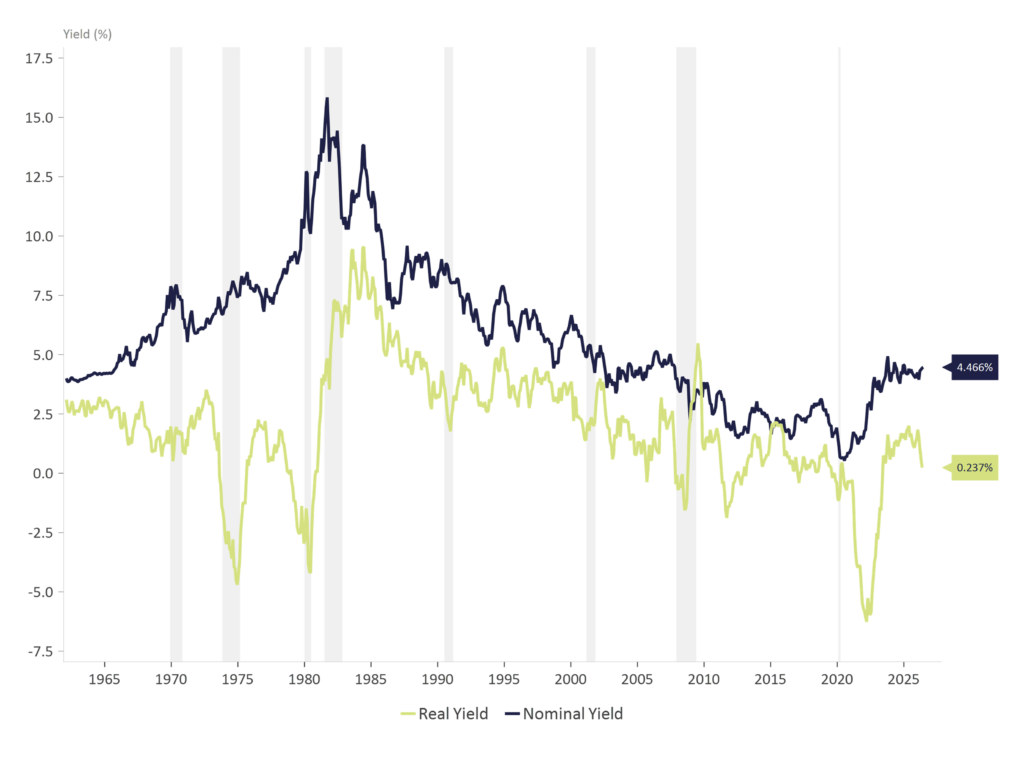
Recessions indicated by shaded area
Bloomberg, GT10 Govt
Daily data available from 1/5/1962 to 7/9/2026
U.S. Bureau of Labor Statistics (BLS), Consumer Price Index, All Urban Consumers, U.S. City Average, All Items, Year over Year Percent Change, Seasonally Adjusted
Monthly data available from January 1948 to May 2026, last released on Wednesday, June 10, 2026
The 10-year Treasury yield, now near 4.5%, remains an important threshold. Historically, a move towards 5% begins to weigh more meaningfully on equities, particularly higher-growth segments that are most sensitive to rates increasing. For bond investors, elevated yields create opportunity, allowing high-quality fixed income to once again play a meaningful role in diversified portfolios.
At the same time, higher rates carry a fiscal cost , steadily increasing the government’s already-significant debt-servicing burden. With the federal debt now close to $39 trillion, roughly 123% of GDP, an estimated $1 trillion will be required to service that debt at current rates, or about 14% of total federal spending in fiscal year 2026. Should economic growth slow, this dynamic could become increasingly challenging as tax receipts would decline but debt servicing costs would not.
US Debt Levels and Debt Servicing Costs Continue to Rise
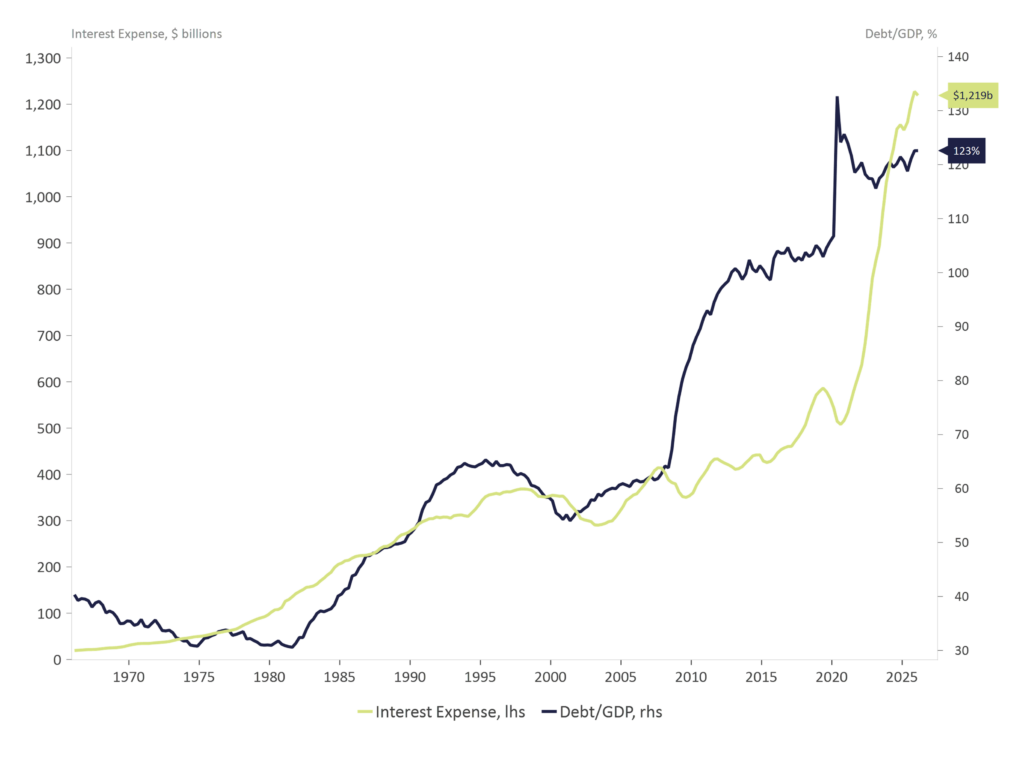
Source: Macrobond, Bureau of Economic Analysis (BEA), Federal Reserve of St. Louis (FRED)
Data: Available quarterly from 1966 Q1 – 2026 Q1
Private Credit
The turbulence that emerged in the first quarter for private credit investors persisted in the second, albeit at a more moderate pace. Private credit funds continue to limit redemptions, defaults are rising, and concerns about AI-related disruption remain a drag on investor sentiment. While these developments do not yet signal systemic stress, private credit markets have never been tested through a full economic cycle, particularly a severe downturn. The combination of structural complexity, rising leverage, limited transparency, and uncertain underlying credit quality creates an added layer of risk, especially as access to these strategies has expanded to retail investors.
Conclusion
Staying Anchored in a Complex Environment
This quarter offered a vivid reminder of how quickly the economic landscape can shift. For the most part, investors shrugged off a major geopolitical shock that caused one of the largest oil supply disruptions since World War II, as investors were confident that the administration would change course before the war severely damaged the U.S. economy or market sentiment. In June, progress towards a peace agreement led to a swift recovery, driving equities towards near-record highs.
The U.S. economy has proven remarkably resilient, delivering solid growth, robust corporate profits, and a labor market that appears stable. Inflation remains sticky and the consumer increasingly bifurcated, but the overall picture is one of durability rather than fragility.
Artificial intelligence remains the connective thread running through nearly every part of this outlook, fueling capital investment and economic growth, driving record corporate earnings, and concentrating market leadership in a handful of names even as participation begins to broaden. Rising margin debt and leveraged-ETF inflows have provided additional support for equity markets recently, particularly within AI-related sectors, but add risk that could amplify market volatility if investment trends begin to disappoint.
Although oil has eased from its highs, it remains elevated, which could keep inflation sticky longer than many expect. This dynamic feeds directly into the third force shaping the outlook: new leadership at the Fed and a reset to higher yields. Lastly, the upcoming midterm elections could introduce additional market volatility and heightened scrutiny of the AI sector. Historically, midterm election years have experienced average drawdowns of 19%, compared to 12% in non-election years. However, those periods of weakness have often created attractive opportunities for long-term investors, with the market generating average returns of 15% in the 12 months following a midterm election.
Stock Returns Have Been Muted Before Election Day
S&P 500 Index average returns since 1931 (%)
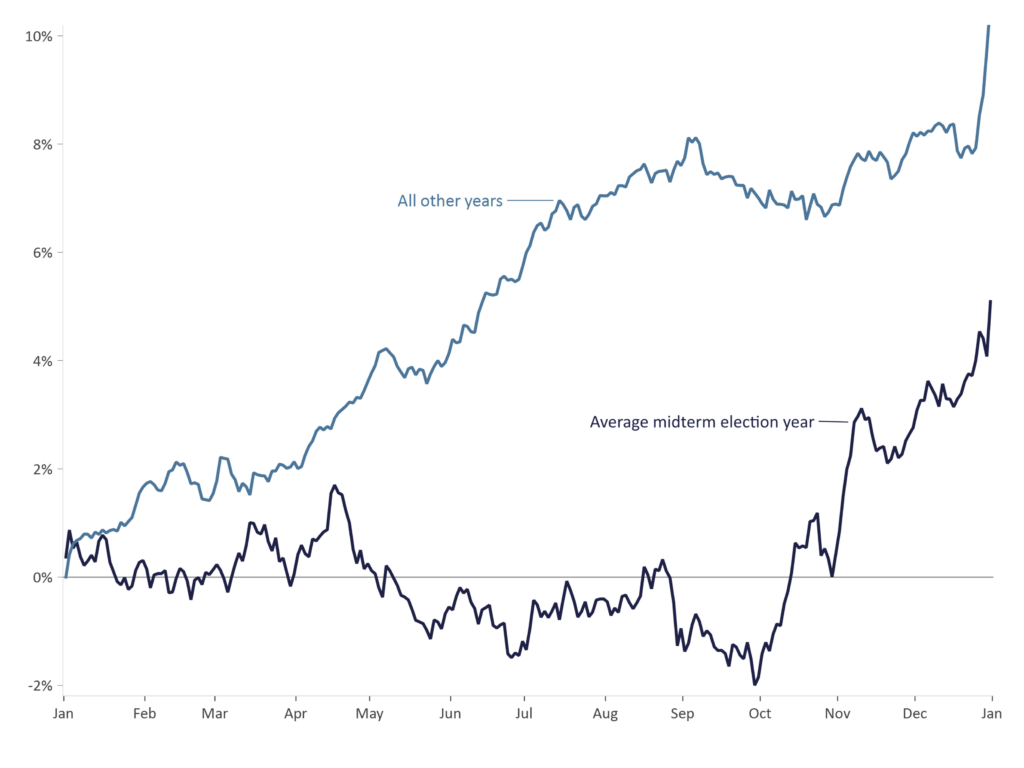
Source: Bloomberg (S&P Index)
Data: Available from 1/1/1931 – 12/31/2025
Each of these forces carries both opportunity and risk, and the interplay among them will likely define the quarters ahead. Above all, we remain focused on what we can control: a disciplined process, thoughtful diversification, and a long-term perspective designed to preserve and grow capital across market cycles.
The information provided here is for general informational purposes only and should not be considered an individualized recommendation or personalized investment advice. Past performance is not a guarantee or indicator of future results. No part of this material may be reproduced in any form, or referred to in any other publication, without the express written permission of 1919 Investment Counsel, LLC (“1919”). This material contains statements of opinion and belief. Any views expressed herein are those of 1919 as of the date indicated, are based on information available to 1919 as of such date, and are subject to change, without notice, based on market and other conditions. There is no guarantee that the trends discussed herein will continue, or that forward-looking statements and forecasts will materialize.
This material has not been reviewed or endorsed by regulatory agencies. Third party information contained herein has been obtained from sources believed to be reliable, but not guaranteed.
1919 Investment Counsel, LLC is a registered investment advisor with the U.S. Securities and Exchange Commission. 1919 Investment Counsel, LLC, a subsidiary of Stifel Financial Corp., is a trademark in the United States. 1919 Investment Counsel, LLC, One South Street, Suite 2500, Baltimore, MD 21202. ©2026, 1919 Investment Counsel, LLC. MM-00002539