Grid Infrastructure Gets a Spark from Vehicle Electrification
Wildfire-induced blackouts in California and more recent events in Texas where unpreparedness curtailed energy supply, highlight the vulnerabilities of the US power grid. These and previous situations tend to be random and are often followed by a call for remedies. Over the next two decades the need for grid investment will be substantial; not driven by the cumulative weight of outages, but by electrification of the transportation sector and continued renewables transition. Continued government support plus improving economics will maintain the clean energy transition for years to come. In 2020, renewables provided 20% of US electricity generation and according to the Energy Information Administration (EIA), will represent 42% of generation by 2050. That forecast could very well prove conservative considering that President Biden’s American Jobs Plan proposes a ten- year tax credit extension for clean energy, including battery storage for the first time. Not to mention a goal to fully decarbonize the power sector by 2035.
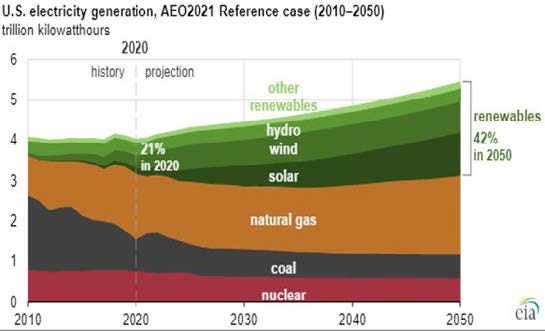
The cost to develop new utility scale (>1MW) wind and solar projects is declining. Large onshore wind sites can now be built for around $1.7 million per MW including interconnection costs, which can vary significantly from project to project due to distance and topography1. As an example, Xcel Energy’s 522MW Sagamore wind project in New Mexico only required a 5-mile transmission line to connect to the nearest substation. Conversely, in Colorado, Xcel is planning a 560-mile 345kv transmission line to connect wind projects in Front Range to areas near Denver at a cost of $1.7 billion, or ~$3m/mile.
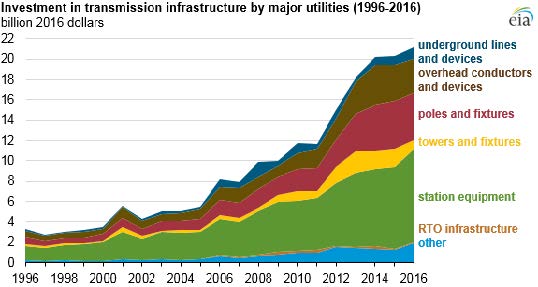
Capacity and equipment upgrades are often necessary to accommodate congestion brought on by connecting multitudes of new generation sources and thus add extra costs. Distances between where renewables are generated and consumed, associated intermittency and an underlying need to balance the grid are placing upward pressure on transmission spending. According to the EIA, utilities accounting for 70% of total US electrical load spent $21 billion on transmission infrastructure in 2016. That could rise significantly over the next decade as electric vehicle (EV) adoption accelerates. An analysis by Wood Mackenzie suggests that doubling renewables generation would require an incremental $70 billion of transmission investment. Beyond 2030, as states execute against RPS and EV adoption spreads, the need for transmission investment will rise, possible by another $200 billion through 2050.2
EV ADOPTION
Electrification of the transportation sector is occurring not just across light vehicles (LVs), but trucks and buses as well. In 2020, EVs accounted for 1.9% of total US car sales according to Edmunds. Most forecasters expect EV’s to reach one-third in 2030 and 50% in 2050, or 6 million and 9 million, respectively assuming an 18 million SAAR (seasonally adjusted annual rate).
Nearly 20 new light duty EV models will be released this year and again in 2022. More are still coming. Both Volkswagen and BMW intend to have 50% of their US lineup electrified by 2030 while GM is pushing for 100% by 2035. Frontend economics are also improving; the list price for a 2021 Tesla Model 3 standard range (263 miles) is now about $3k less than that for a BMW 330i and both generate similar horsepower. The long range Model 3 (353 miles) priced at $47k, however, is $6k more expensive. After five years of fuel savings, assuming 12k miles per year at a consumption rate of 30mpg, the premium is reduced to under $2k3. As battery prices decline on a kWh basis, upfront EV prices generally speaking should approach parity with those of ICE (internal combustion engines) vehicles around 20234.
BROADENING SUPPORT
Robust EV support at the federal, state, and local levels is either in place or coming into place. Federal tax credits of up to $7,500 are available for buyers, but only for qualifying vehicles5. Further, President Biden’s American Jobs Plan proposes new and as yet to be detailed incentives and rebates for EV purchasers.
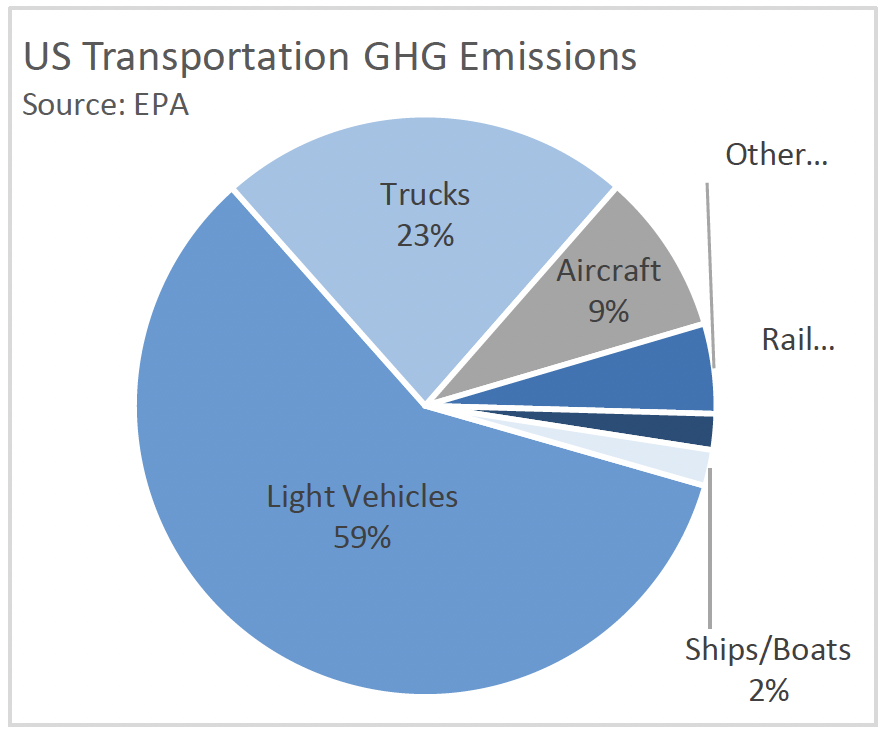
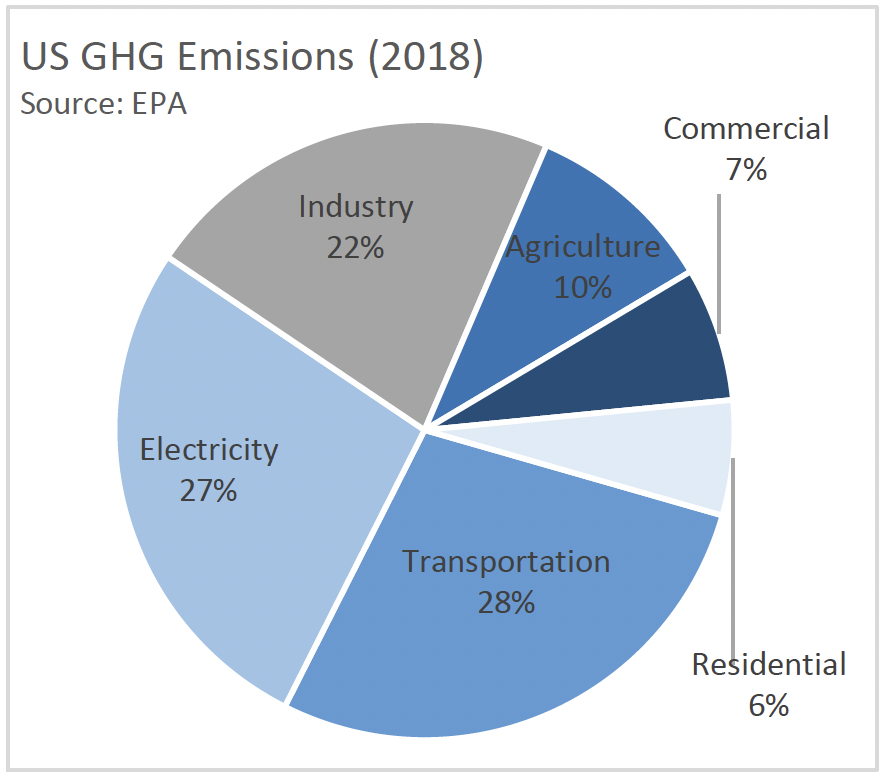
States are also taking supportive action. Thus far, 29 plus Washington DC have established RPS (renewable portfolio standards) that require procurement of 100% renewable power by future dates. Of these, 12 have committed to fully decarbonize. According to the Environmental Protection Agency (EPA), transportation is now the largest contributor to Greenhouse Gas (GHG) emissions followed by the power sector. In order to make good on these commitments, broad EV adoption will be needed and thus require more renewable power generation. After all, the intent is to charge with wind and solar rather than fossil fuel.
Connecticut is one such state seeking to become net zero (by 2040). Transportation accounts for 38% of the state’s GHG emissions and it has signed a zero-emission vehicle (ZEV) MOU along with 15 other states and Washington DC. There were 11,677 EVs registered in CT at the end of 2019 and it has set a goal of reaching up to 150,000 by 2025. In addition to LV EV adoption, conversion of public and private truck fleets that travel less than 250 miles-per-day and that can be charged at a central depot are a means to that end.
TRUCKS AND BUSES
Until range anxiety is sufficiently addressed, the use of all-electric Class-8 trucks for long haul moves may be limited. However, companies including Arrival, Workhorse, Chanje, Rivian, and Lion Electric are making electric delivery vehicles and buses and have production contracts in place with some of the largest US fleets (UPS, FDX, and AMZN). School buses, in particular, offer an interesting opportunity since for the most part they are parked. In a given school day, buses drive an average distance of 66 miles while the battery pack can accommodate a range of 125 miles, leaving half a charge that can be sold back to the grid6. Plus, since they are typically idle in the evenings and during summer months, batteries can be charged with cheap solar during the day and discharged at night. Below is an exhibit that overlays a theoretical electric bus integration with the duck curve, which shows the impact of solar on base load generation throughout the day.
EV Bus Potential Use Vs. Duck Curve
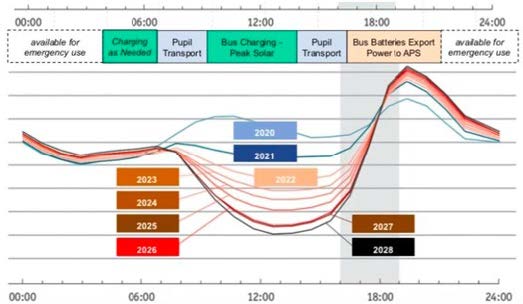
Source: Arizona Public Service, Advanced Energy Economy
Adoption is already happening. In Montgomery County, MD, the Board of Education recently approved a 16- year, $169 million contract to lease 326 Thomas Built EV school buses and install centralized charging infrastructure at five depots. The fleet will be charged during off-peak hours with excess energy sold back to the grid when not in use. Further, one goal under President Biden’s American Jobs Plan is to convert 20% of the nation’s yellow school bus fleet, or ~100k vehicles, to electricity.
CHARGING INFRASTRUCTURE
The configuration for building a nationwide public charging network is coming into view. It will be funded by both public and private capital and comprise Level 2 charges, which use 240V current and provide 20 miles of charge per hour, and Level 3 fast chargers that use 480V and deliver 100+ miles each hour. According to a report from NREL (National Renewable Energy Lab), there are nearly 13.5k public Level 3 chargers installed in the US and nearly 66k Level 2 chargers. This is a fraction of what will be needed by 2030 if EVs account for ~1/3 of new vehicle sales. To eliminate range anxiety and accommodate EV owners whose residence may not be suitable for charger installation, NREL estimates that one Level 2 charge point per 25 EVs while one Level 3 charge point for every 545 EVs will be necessary. By 2030, the cumulative number of EVs on the road could approach 20m, implying that 800k Level 2 and 36k Level 3 charge points are needed. Proportionately, only ~8% of the Level 2 charging stock needed by 2030 is now in place. Moreover, nearly 40% of the Level 3 stock is in place, but half is estimated to be accessible only by Tesla drivers. By 2040, there could be 80m EVs on the road, representing 25% of the installed base and implying an incremental 1.6m Levels 2 and 73k Level 3 chargers would be required.
In August 2020, a proposed decision for Southern California Edison’s Charge Ready 2 Infrastructure program budgeted a cost of $15k per Level 2 port. This, reflects equipment including switchgear, conduit, and meters as well as engineering and labor. A Level 3 port is much more expensive due to the need for a dedicated transformer and can cost upwards of $90k. Based on these inputs, just over $15 billion of infrastructure investment is needed to accommodate 20 million EVs by 2030. That amount increases to over $60 billion by 2040. The American Jobs Plan stands to help in this regard by earmarking $15 billion to incentivize development of a national network of 500k public charge points.
LOAD GROWTH
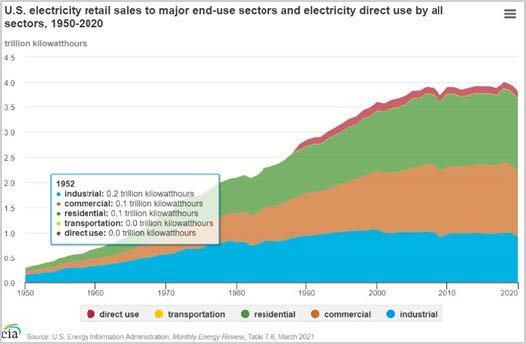
EV adoption will put upward pressure on load growth. In 2020, the US consumed about 3,800TWh of electricity and according to the EIA, electricity use only grows around 1% since energy efficiency largely offsets higher economic consumption. At 25% penetration in 2040, LV EVs would consume 220TWh of electricity. At the same adoption level, trucks and buses would draw 315TWh given their higher annual mileage. On a combined basis, EVs could add 14% to steady state electricity consumption by 2040. That could be impactful as incremental load places added stress on the grid, which is already aging. According to a 2015 EIA report, 70% of transformers are at least 25 years old while 60% of circuit breakers are at least 30 years old. Load growth will be uneven with regional pressure points occurring where EV adoption is fastest. A Level 3 charger can draw a load equal to that of 50 houses; as capacity limits are reached on existing infrastructure, upgrades will be required to ensure sufficient resource adequacy. In light of regional load growth characteristics, predicting investment needs is challenging. Morgan Stanley is using an estimate of $190 per EV, implying over $11 billion in capital cost by 2040. Other forecasts are substantially greater. Additionally, the amount of new renewables generation needed to charge these vehicles by 2040 could reach 206GW of nameplate capacity. Using an all- in capital cost of $800k/MW down from $1.2m/MW-$1.7m/MW today, implies a price tag of $165 billion.
MANAGED CHARGING
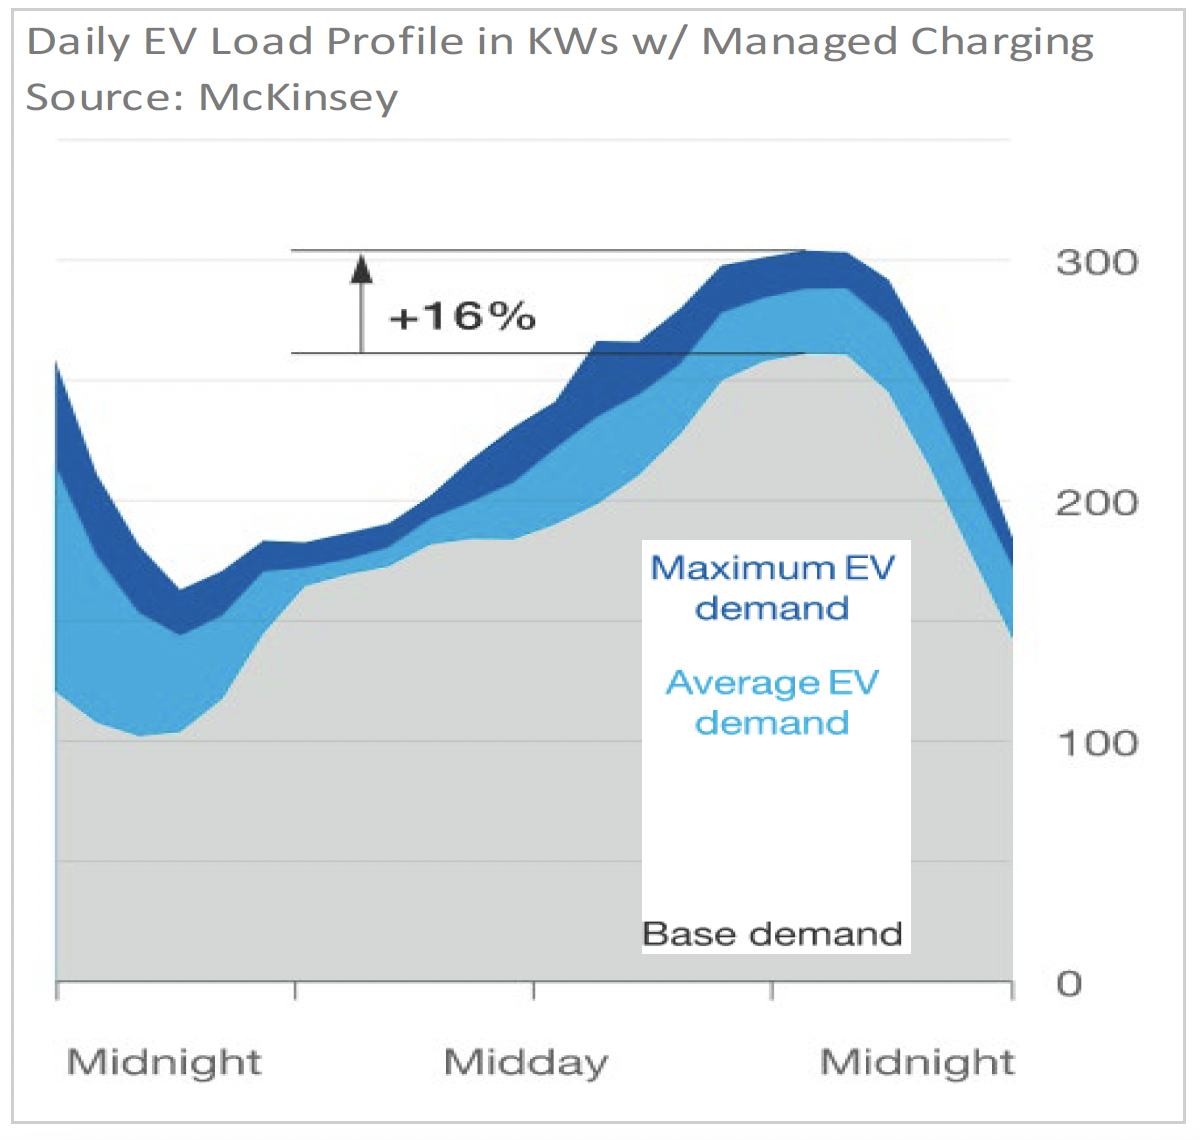
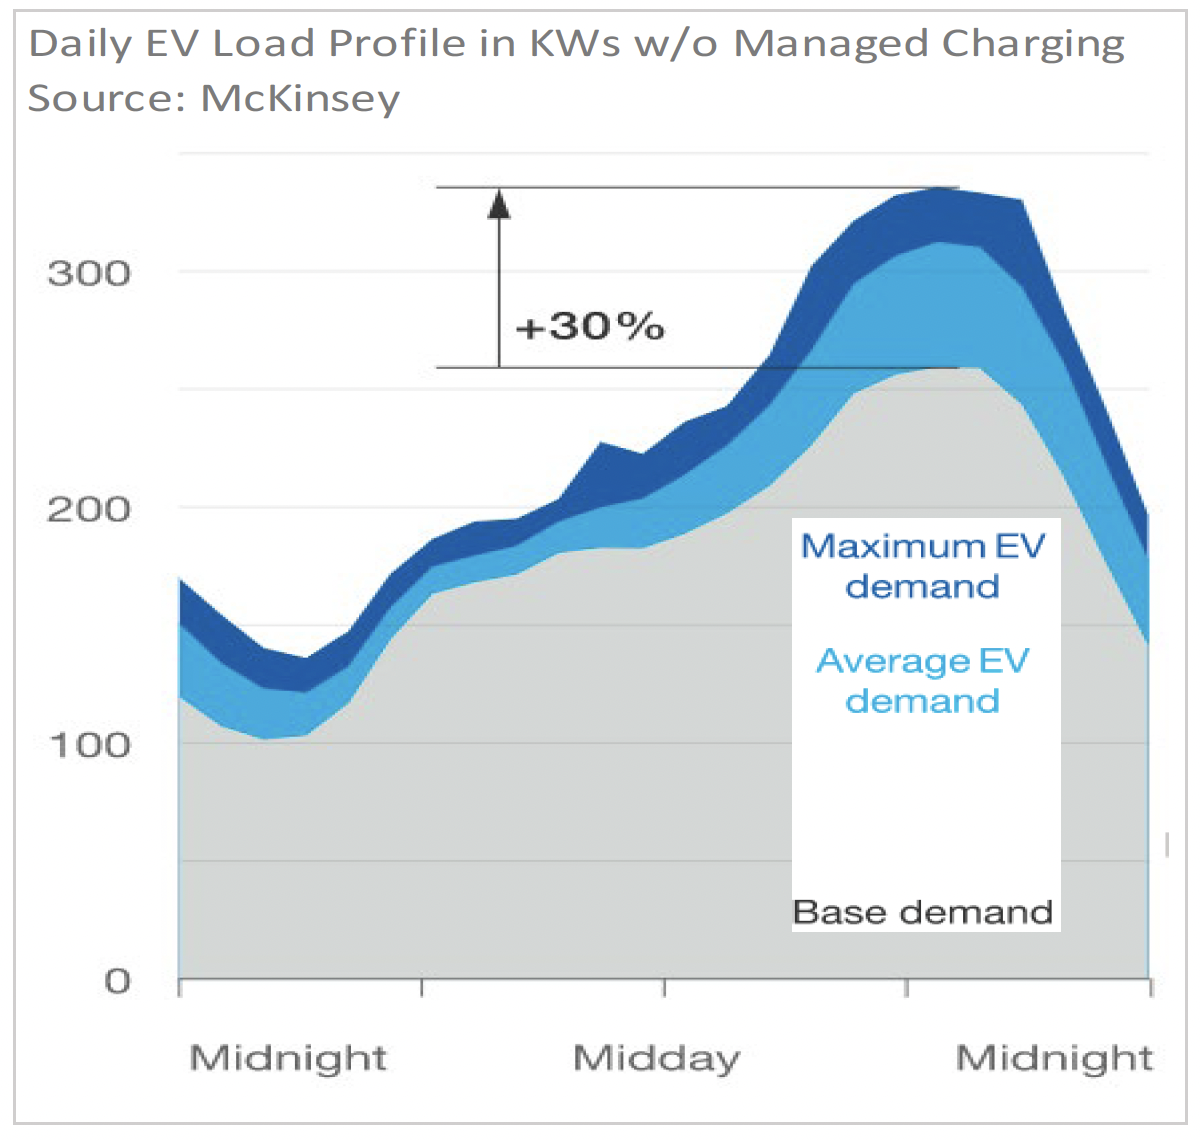
That’s a tall order. But, managed charging, where utilities essentially incent EV owners to charge during off peak hours, could help ease the burden. Plus, many EV owners will have the option to charge overnight when electricity is plentiful and rates are low. According to the DOE, at least 80% of EVs are charged at home. But that seemingly reflects current demographics of EV ownership today, not in the future. Capacity availability varies from region to region as will the pace of adoption, so localized stress could certainly develop. Also, renewables only account for 21% of US generation, which means that electricity from fossil fuels would likely be used for charging, especially since solar isn’t available at night and thus misses the spirit and intent of EVs. Assessing the net incremental generation need is a dart throw and is in large part of function of charging behavior. Nevertheless, about 63% of US housing stock is single family detached homes7. Assuming that 63% of EV owners charge at home and that overnight capacity is sufficient to accommodate that load, 37% of new generation would be required, or 71GW at a cost of $70 billion. However, if vehicles are charged solely with renewables, that number would be conservative. Below are two charts that show demand profiles for EV charging on a September day in the Midwest assuming 25% penetration on a typical feeder circuit serving 150 homes.
UTILITIES
Electric utilities are gate keepers to the grid and as such are set to play a central role in EV infrastructure. Additionally, as regulated entities, they are allowed to earn a return on capital investments, which means EV infrastructure could provide an incremental source of rate base growth. Collectively, the investments outlined above could amount to $190 billion (T&D, EV charging, and generation) through 2040. For context, according to the EIA and the Edison Electric Institute, utility capital spending on transmission, distribution, and generation was roughly $100b in 20198. Total capex, including nat- gas, reached $125 billion and has grown at a ten-year CAGR of 6%. Thus, preparing the grid for EVs over the next 20 years would elevate overall capital spending by over 50% to 10% on a straight line basis. This is easier said than done because state public service commissions (PSCs) control a given utility’s ability to invest by regulating ROEs and equity ratios. And, it is unlikely that PSCs would sign off on higher thresholds since higher capex would flow through to customer bills. Plus, many PSCs, including in CT, have yet to greenlight make-ready EV programs to begin infrastructure buildout. Still, there remains a clear upward growth bias for electric utility capex over the next few decades. We continue to believe that NextEra Energy (NEE), which is a renewables leader, and Eversource Energy (ES), a unique “wires only” utility in New England, are well positioned to benefit. Additionally, electrical equipment company, Eaton Plc. (ETN) will provide many of the building blocks utilities require to enable an EV transition.
FINAL CONSIDERATIONS
The above analysis focused mainly on EV infrastructure needs by 2040, a point sufficiently in the future to capture an inflection in EV adoption. However, prevailing industry expectations are that EV penetration reaches 50% by 2050, a level that could require twice the investment needs outlined in this paper. It is also important to point out that policy, economics, and technology are variables that could influence EV adoption and associated infrastructure needs. Storage is set to play a major role so that solar can be utilized in the evening or overnight and was not included in the analysis, nor was V2G (vehicle-to-grid) capability that will allow EVs to discharge load back to the grid. Regulators for their part still need to determine how to enable such a buildout and much could change in the meantime. At the end of day, federal, state, and local governments as well as corporations, auto OEMS, and vehicle owners have largely aligned on EV adoption and that will require a wave of capital for decades to come.

ERIC G. THOMPSON, CFA
Principal, Equity Research Analyst
Eric is a Vice President at 1919 Investment Counsel, LLC. His primary responsibility is as an Equity Research Analyst covering the Industrial and Utility Sectors. Eric has over 16 years of experience as a Research Analyst with 15 of those years following the Industrial Sector. Prior to joining the firm, Eric was a Senior Equity Ana-lyst covering Industrial and Healthcare companies at Wilmington Trust Investment Advisors. Prior to this, he was an Associate Analyst with Legg Mason.
Eric is a CFA charterholder and received an M.B.A. from Cornell University’s Johnson Graduate School of Management. He earned a B.S. in Finance from Towson University.
1 Xcel Energy Sagamore Wind development cost of over $900m with nameplate capacity of 522MW.
2 Brattle Group
3 Tesla Model 3 long range with an 82KWh battery charged at a rate of 11c/mile. Assumed $3.00 price per gallon of gasoline.
4 Source: Bloomberg New Energy Finance
5 The credit does not apply once the manufacturer has sold 200,000 qualifying vehicle. Federal tax credits no longer apply to Tesla or GM vehicles.
6 125 mile range referenced from Lion Electric’s LionC electric school bus with battery capacity option of 168kWh.
7 https://www.census.gov/content/dam/Census/programs-sur- veys/ahs/tech-documentation/Structure%20Type%20Esti- mates%202017%20and%202019.pdf
8 https://www.eia.gov/todayinenergy/detail.php?id=47316, https://www.eia.gov/todayinenergy/detail.php?id=48136, https://www.eei.org/issuesandpolicy/Finance%20and%20Tax/EEI_In-dustry_Capex_Functional_2020.pdf